To get a winning trading system you have to take into account the technical analysis indicators.
In this article, I will present a complete guide on them to build or complete your trading strategy.
Of course, not all the indicators invented so far are described, but those that I consider essential to know.
What are the technical indicators?
The technical indicators are complements that you add to the price chart and that offer you extra help to obtain some statistical advantage in the market.
The indicators serve either to confirm what you think the price will do or to refute your market hypothesis.
They are mathematical formulas based on price and other variables whose objective is to offer a visual result that is useful for chart analysis.
After all, all the indicators are very similar to each other, so you could say that there is no one better than another.
It all depends on the use you give it and which one you find most comfortable.
Mainly, there are two major types of indicators:
- Oscillators.
- Trend following indicators.
Before going into detail, I want you to know that there is no infallible indicator and that you have to use them for what they are: An extra help to your analysis. Each serves for one thing and they have their advantages and disadvantages. As advice, it is usual to use at least one of each type.
Trading with oscillators
Oscillators are indicators that, as the name implies, are constantly oscillating and crossing one or several levels, through a more or less violent movement.
The placement of these key levels and how quickly the value of the indicator moves depends on the type of oscillator and its configuration.
Oscillators indicate before other indicators on changes in trend and price movements.
But this has a disadvantage: They give many false signals.
That’s why you have to use them with common sense.
I want to talk to you about the three main oscillators that I use. If you feel more comfortable with others, perfect, the important thing is that they serve you.
These are the oscillator type indicators that give me the best results:
Force Index
The Force Index oscillator was created by Alexander Elder and the elements used to calculate it are the last two prices and volume.
Nothing complicated, but very efficient.
This is what he looks like on the graphic:
This is what this indicator looks like in the price chart:
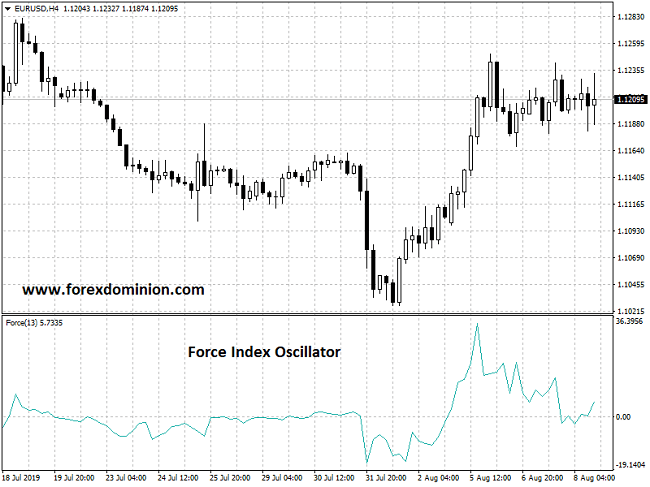
In ForexDominion we use this indicator on the daily chart and on the H4 chart as it is really sensitive to market movements.
I consider it a basic element for my workspace.
If you have not yet considered using this tool, it is a good time to know how to use and configure the Force Index.
Stochastic Oscillator
This oscillator is similar to Force Index, but not the same.
Also, the stochastic oscillator is not so sensitive, but it detects very well the oversold and overbought conditions in the market.
In the words of its creator (George Lane), the stochastic follows the speed or momentum of the price.
Visually it is quite different, since the value ranges between 0 and 100, having two important levels:
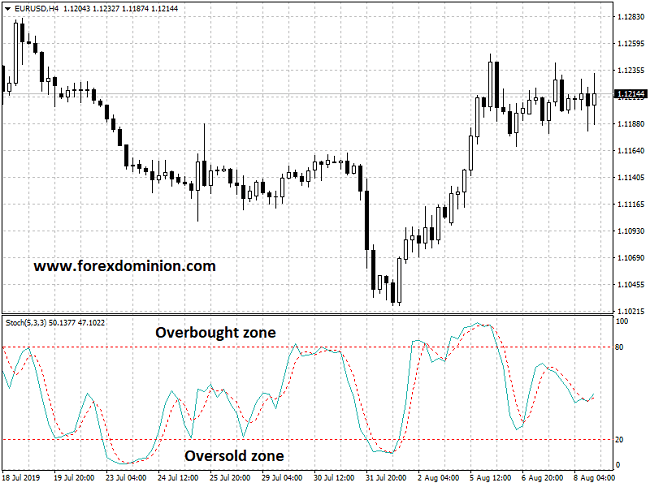
The areas delimited by the red dotted lines (overbought or oversold zone) are the ones that will mark you an opportunity to buy (oversold zone) or sell (oversold zone).
The values of these levels are customizable and you will have to modify them depending on your analysis (time frame of the trade, type of price chart, strategy, etc.).
I usually use the stochastic oscillator less than other indicators, since I have it reserved for very specific strategies and moments.
RSI oscillator
This technical indicator can also be found as the “Relative Strength Index”.
Quoting directly from Wikipedia: It shows the strength of the price by comparing the individual upward or downward movements of successive closing prices.
Like the stochastic oscillator, the value of the indicator moves between 0 and 100, with their respective levels, visually indicating when the price is “cheap” or “expensive”:
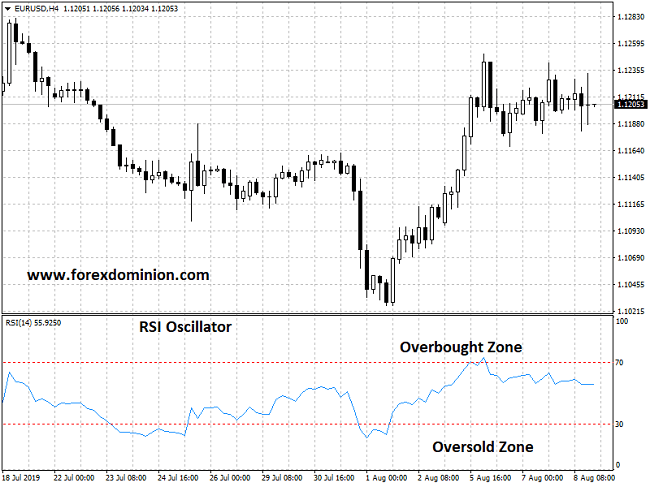
As you can see, it is very similar to the stochastic oscillator, although the RSI may be more accurate if you configure it correctly.
By default, it is configured with 14 periods, but for me sometimes this seems excessive. Between 3 and 9 periods are values that I use.
Here is an article to know how to use the RSI indicator in our market analysis: RSI Guide for Traders
Trend following trading indicators
These indicators serve to (surprise!) determine the market trend so that the trader can get on that trend with a higher probability of success.
They help you observe more clearly where the price is going.
The negative part of trend-following indicators is that they are slower tools when it comes to detecting trend changes.
The following indicators are those that I consider mandatory:
Moving averages
The moving average is the most basic indicator that exists and, in my opinion, it should always be present in our price charts, or at least in the time frame that exceeds the time frame in which we are trading.
A well-adjusted moving average will provide you with two important data:
- The sense of the trend: At a glance, you will see if you are facing an uptrend or downtrend, so you can decide in seconds how to raise the trade. It is also true that on certain occasions (lateral markets), a trend indicator will not help you much.
- Price-value tension: The moving average shows you the reasonable price of the value you want to trade. Thus, if the price is very separate from the average, it is said that the price-value tension is high and that it is normal for this tension to be reduced sooner or later and a price approach to value occurs.

If you do not adjust very well a moving average, you will not cause a catastrophe in your trading and you will be more or less in tune with the price.
However, if you calibrate correctly your moving average, you will noticeably increase your likelihood of achieving your goal.
Adapting a moving average to each market that you are analyzing will cost you a few seconds, and will serve to improve our analysis and results in the market.
Apart from trading in the right direction of the trend, you will have to do it at the right time. And this moment is when the price reaches the moving average, thus reducing the price-value tension.
MACD
I have left the MACD indicator for the end, however, it is not less important, but quite the opposite.
MACD is one of the most robust and stable indicators that exist.
One of the great advantages is that it does not require changing its configuration every time you analyze a different market.
Visually it is very comfortable to interpret and as soon as you apply it you can see who is running the market at that time: Buyers or Sellers
In case you have never seen it, this is its appearance:

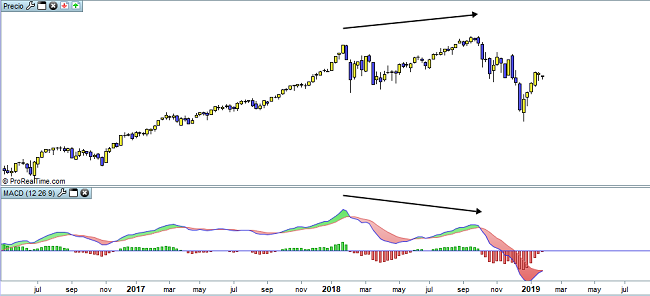
In my weekly chart the MACD is never missing and on more than one occasion (and more than two) it has helped me a lot, especially with its divergences.
As an example (one of many), I put a great divergence that anticipated the fall in the SP500:
Why should we use technical indicators in trading?
Very simple: Because they help you.
The technical indicators are a great support to alert, confirm and predict the price movement.
In addition to the signals and clues that the indicator can give you as such, what I like most about using these tools is the possibility of detecting divergences with the price.
In many cases, a divergence is the final trigger to opt for a trade or reject it.
In fact, you find examples in many markets, you just have to know how to take advantage of them.
In short, I think that good use of technical indicators can give you a huge advantage.
Of course, getting a smooth handling of them and understanding them correctly takes time for learning and training.
As a final tip: Don’t put too many indicators in your charts. You will only get a confusing chart because you will see too many different signals that cloud your global vision. This is always counterproductive.
I am Raúl Canessa, the founder of Forexdominion.com. As an experienced Forex trader, my passion for investing and algorithmic trading has shaped my professional journey. Over the years, I have dedicated myself to refining my skills in the financial markets, allowing me to share my knowledge and insights through my platform. I am committed to helping others understand the world of trading and develop effective strategies for success in this exciting field.
 Indicator")


 - Main Features")
