In this article we will continue with the series of articles on scalping and daytrading strategies based exclusively on Price Action that may be useful for you to trade in Forex, although they can also be adapted to other markets.
These strategies are based on the identification of classic price patterns from technical analysis.
You can access the second article in the series at the following link: The Best Forex Daytrading Strategies II
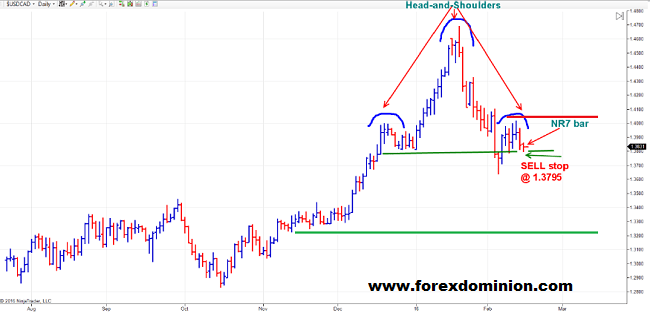
Day Trading Strategy # 11: (Head and Shoulders with NR7 pattern)
-Price pattern detected: If the formation of a Head and Shoulders pattern is detected, we look for the formation of a candlestick called NR7 (this is the name of the candlestick with the lowest range of the last 7 sessions) in the neck line.
-Entry order type:We place a sell stop order slightly below the low of the NR7 candlestick. If after a few hours the price does not reach the stop order, we will cancel it.
-Profit Target: It is a classic chart pattern that, if verified, generates prolonged movements in time, so we must place the objective quite far away. We can also take advantage of the drop projection of the pattern.
-Stop Loss: The stop loss is placed at a level that allows a benefit/risk ratio of 3:1 or higher.
Example of the strategy in the USD/CAD
After a clear Head and Shoulders pattern forms, an NR7 candlestick forms with a low at 1.3800 so we place a stop sell order at 1.3795, with a profit target at 1.3200 and a stop loss at 1.4000, which gives us a benefit/risk ratio of 3:1.
Day Trading Strategy # 12: (Triple Top/Bottom Strategy with Inside Day)
-Price pattern detected: If the formation of a Triple Top or a Triple Bottom pattern is detected, we will look for an Inside Bar candlestick near the pattern base.
-Entry order type: In the case of a Triple Top pattern, a sell stop order is placed slightly below the Inside Bar minimum, while in the case of the Triple Bottom pattern, a buy stop order is placed slightly above the maximum of the Inside Bar. If after a few hours the price does not reach the stop order, we will cancel it.
-Profit Target: The next exit point or profit target will be located at the next support or resistance. We can also take advantage of the downward or upward projection of the pattern.
-Stop Loss: We can place the stop loss at a level that allows a benefit/risk ratio of 2:1 or higher.
Example of the strategy in the NZD/CAD
After a Triple Top pattern is formed in the area between 0.9400 and 0.9500, an Inside Day candle is formed. At that time, a sell stop order is placed below the Inside Day low of 0.9056. with a stop loss slightly above the Inside Day high at 0.9180. The profit target is at 0.8600, which gives us a benefit: risk ratio of 3:1.

Day Trading Strategy #13: (Support/Resistance Breakout with Price Reverse and Reversal Bar)
-Price pattern detected: We first look for a significant breakout of a relevant support or resistance level and wait for a pullback to occur. The price retracement should be stopped at the newly broken level. Next we look for a price reversal candlestick.
-Entry order type: In the case of a resistance breakout, we will wait for the corresponding bearish pullback and once the Reversal candle is confirmed, we will place a buy stop order above its maximum. On the other hand, in the case of the breakout of a support, after the correction and the confirmation of the Reversal candle, we will place a sell stop order below the minimum.
-Profit Target: The exit or profit taking level will be located at the next support or resistance.
-Stop Loss: We can place the stop loss at a level that allows a benefit/risk ratio of 2:1 or higher.
Example of the strategy in the EUR/USD
After violently overcoming the resistance at 1.1050, the price falls and consolidates above the resistance crossed, forming a reversal candlestick. At that time we place a buy stop order above the reversal bar high at 1.1141, with a take profit target in the next resistance at 1.1400 and a stop loss slightly below the reversal bar low at 1.1040. This gives us a benefit/risk ratio of 2.6:1.

Day Trading Strategy #14: (Cup with Handle Pattern with Inside Day)
-Price pattern detected: If a Cup and Handle pattern formation is detected, we look for the formation of an Inside Day candle during consolidation on the handle.
-Entry order type: A buy stop order is placed slightly above the high of the candle prior to the Inside Day. If after a few hours the price does not reach the stop order, we will cancel it.
-Profit Target: The exit or profit taking level will be located at the next support or resistance.
-Stop Loss: We can place the stop loss at a level that allows a benefit/risk ratio of 2:1 or higher.
Example of the strategy in the spot gold (XAU/USD)
As we can see in this example, not one but two Inside Day candles are formed inside the pattern handle, which is a clear warning that significant movement is going to occur soon. Taking as reference the maximum of the candle that surrounds the Inside Days, a buy stop order is placed in 1096, with a profit target around the next resistance in 1118 and a stop loss in 1087, which gives us a benefit/risk ratio of 2.4.

Day Trading Strategy #15: (Rectangle Pattern with Double Top Pattern and Reverse Bar)
-Price pattern detected: It is a fairly complex pattern consisting of two parts. In the first part, a rectangle pattern is formed in which the price breaks down. Subsequently there is an upward correction that ends with a double top, within which we must look for a Reversal candle.
-Entry order type: A sell stop order is placed below the Reversal Bar minimum. If after a few hours the price does not reach the stop order, we will cancel it.
-Profit Target: The exit or profit taking level will be located at the next support or resistance. In any case, this pattern type usually generates huge profits, so we must try to capture a strong price movement.
-Stop Loss: We can place the stop loss at a level that allows a benefit/risk ratio of 2:1 or higher.
Example of the strategy in the AUD/NZD
After confirming a clear maximum level in the form of a rectangle pattern, there is a correction in the downward movement that remains within the range of the rectangle. Then a Double Top is formed with decreasing highs and finally we have a Reversal Bar. At that moment we place a sell stop order below the minimum of the reversal bar at 1.0955 with a profit target of 1.0500 and a stop loss at 1.1050. The benefit/risk ratio this time is 4 to 1.

I am Raúl Canessa, the founder of Forexdominion.com. As an experienced Forex trader, my passion for investing and algorithmic trading has shaped my professional journey. Over the years, I have dedicated myself to refining my skills in the financial markets, allowing me to share my knowledge and insights through my platform. I am committed to helping others understand the world of trading and develop effective strategies for success in this exciting field.


