Indicator of Balance of Forces Between Buyers and Sellers in All Time Frames for MT4

In this article we are going to explain a modified indicator for Metatrader 4, which measures the balance of forces between buyers and sellers for each time frame, from M1 to D1, in the form of red and green histograms. This indicator is called Strength Candles, and for each time frame it shows the ratio between buyers and sellers in a range from 0 to 100%. It can be used primarily to determine the strength of the current trend.

The Strength Candles show the total balance between the buying and selling forces in percentage terms. This strength indicator does not use typical indicators such as RSI or moving averages, therefore the information is provided without any delay.

It is not an indicator that provides entry and exit signals like others. Its function is simply to inform about the balance between the forces in the market for different time frames.

Read more

Renko Chart Indicator for Metatrader 4

Renko chart MT4

The MT4 platform is undoubtedly one of the most popular trading platforms among retail traders who regularly trade Forex, CFDs, and precious metals. Despite the popularity and numerous reviews of the MT4 platform, there has been little to no improvement when it comes to including other types of charts. In its current version, Metatrader only offers the classic types of price charts, that is: bar charts, japanese candlestick charts, and line charts.

Although MT4 has shown some lag in terms of chart type innovation, thanks to the large ecosystem of developers who specialize in the MT4 platform, various Renko indicators have been produced that can convert existing chart types to Renko charts.

In this article we are going to take a look at the RenkoLiveChart_v3.0 indicator which is available free of cost, indicating its advantages and disadvantages.

Read more

1-2-3 Patterns Indicator for Metatrader 4

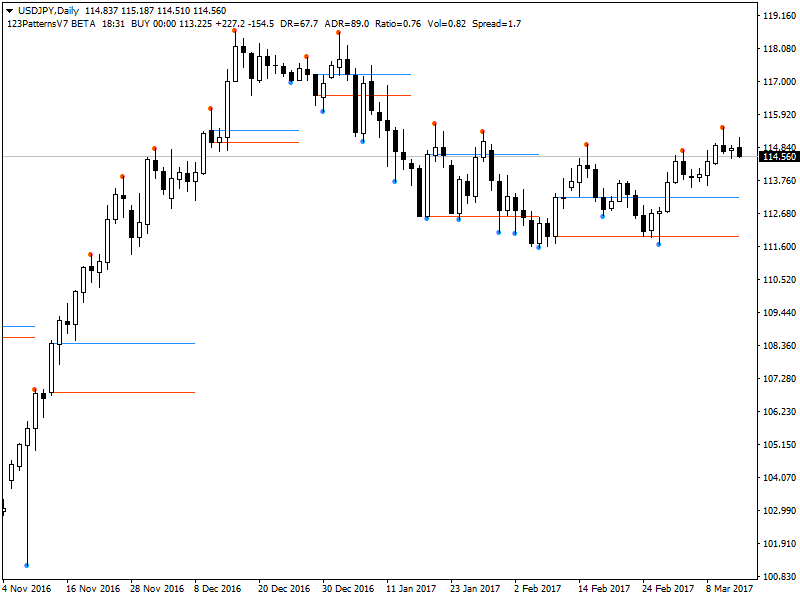
The 1-2-3 pattern is a classic trend reversal price formation that occurs in all markets and can be observed in any time frame. It has stood the test of time thanks to its reliability, which is high compared to other chart price patterns. In fact, many trading strategies today are based on this chart pattern.

However, as with all price formations, the problem is learning to spot 1-2-3 patterns on the price charts, which is not easy for beginning traders due to their lack of experience. Also, most traders don’t want to spend their hours watching price charts. I think this is one of the main reasons why pattern-based strategies don’t work for many traders.

For that reason, we include a free custom indicator for Metatrader 4, which shows 1-2-3 bullish and bearish patterns on any price chart and in any time frame. This tool saves the trader a lot of time and works as they do not have to find the patterns on their own.

Read more

Three Line Break Indicator for Metatrader 4

Line Break Chart for MT4

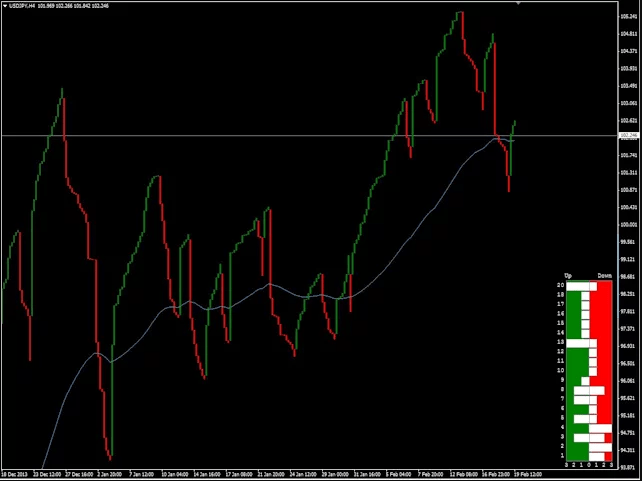
Three Line Break charts were invented in Japan and are similar to Renko and Point & Figure charts. One trader from Japan described Three Line Break charts as a “more subtle form of Point & Figures charts, where reversals of price direction are decided by the market and not by arbitrary rules”. One of the most notable features of these charts is that they are time-blind and only change when closing prices move by a certain number of points higher or lower.

These charts show a series of vertical lines (or “blocks”) of varying size (Renko charts uses a fixed block size). Green blocks (traditionally white) represent rising prices, while red blocks (traditionally black) portraying falling prices. The blocks continue in the same direction until a price reversal is warranted.

Read more

Free Scalping Indicator for Metatrader 4

Free scalping indicator example

Introduction

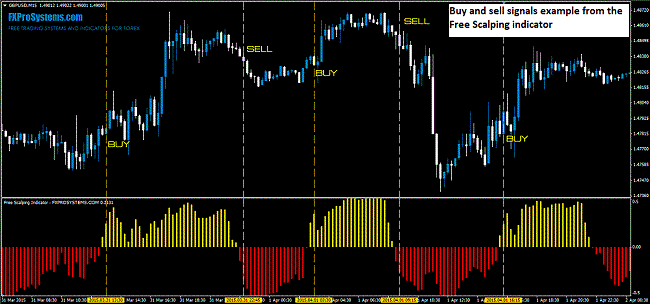
Scalping is a very popular trading style because it allows obtaining multiple profits with short-term trades and can be used in practically any asset and financial instrument. Likewise, it does not require a deep knowledge of fundamental analysis (although it is always convenient to take these events into account) or technical analysis. In fact, many scalping trading systems are based on relatively simple approaches.

Scalping is applied in short-term time frames in which micro trends are formed that last a few minutes and require fast entries and exits. For this reason, scalping is not for traders who prefer to perform long-term trades that generate hundreds and even thousands of pips of profit, which in fact appear only a few times a month.

Read more

Free QQE Indicator for Metatrader 4

QQE Indicator for MT4

In this article we are going to present a technical indicator designed for the Metatrader 4 platform which displays the QQE (Quantitative Qualitative Estimation) indicator below the price chart of any trading instrument that we are analyzing, be it a currency pair, a precious metal, an index or a stock.

At the end of this article, you will be able to download the indicator at no cost.

Read more

Modified Indicator Forexorama – MACD For MT4

Example of Forexoma indicator

The Forexoma-MACD is a modified indicator designed for the Metatrader 4 platform which is based on the MACD technical indicator. It was designed to be easier to read for the trader, as standard MACD signals can be somewhat complex for the beginner trader. In addition, it is designed to detect trend changes earlier as we will see later. It is a color-coded indicator which changes its color as soon as the analyzed asset changes trend.

This allows traders to detect the market trend much earlier than they could with the conventional MACD on the MT4 platform. The Forexoma-MACD actually works as a histogram whose bars change their color according to the current trend. Using the conventional MACD indicator on some occasions can cause traders to open their positions in the market when most of the price momentum is diminishing. This causes the trader to lose valuable pips of profit that could be obtained if he opens his positions earlier.

Read more

Mcginley Dynamic Indicator For Metatrader 4

Mcginley Dynamic Indicator for MT4

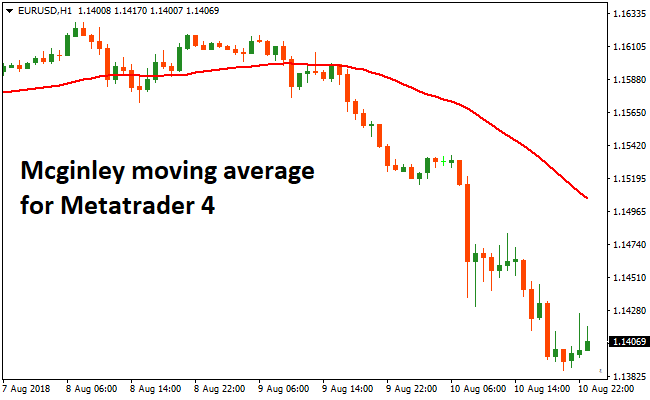
The Mcginley Dynamic Forex indicator for the Metatrader 4 platform is an indicator based on moving averages that have a smoothing factor to reduce false signals.

Its trading signals are very simple:

  • If the price action is above the Mcginley indicator: look for possible buy signals.
  • If the price action is below the Mcginley indicator: look for possible sell signals

The indicator settings (period, smoothing factor) can be changed directly from the indicator settings tab.

As with any technical analysis tool, it is not recommended to use this moving average as the sole criterion for analyzing and opening positions in the market. Use it in conjunction with an oscillator type indicator (such as the MACD, or the stochastic oscillator) to build a complete trading system.

Read more

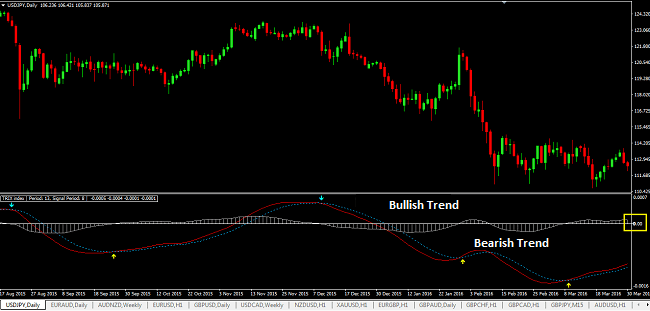
TRIX Indicator for Metatrader 4 – Free MT4 Indicator

Trix indicator for MT4

In this article, we are going to show a modified indicator for Metatrader 4 that allows adding the Trix indicator to the price charts on this trading platform. Initially we explain what is the Trix and how it can be used to analyze the market and trade. Later we will show the most common strategies to trade with this technical tool and finally, we include the modified indicator for download, along with its setting parameters.

Before we begin, we want to point out that as with any other technical indicator, the Trix and its signals should not be used alone to make important decisions regarding our trades.  It is recommended to use a set of analysis tools (a complete trading system) that provide an overview of what is happening in the markets.

Read more