Introduction
Opening MetaTrader 5 for the first time can feel overwhelming. There are panels everywhere, numbers updating in real time, menus inside menus, and toolbars you haven’t learned to read yet. But here’s the truth: MT5 follows a very logical layout, and once you understand what each section does, everything clicks into place.
This article is your guided tour of the MT5 interface. We’ll walk through every major panel — Market Watch, Navigator, Toolbox, and the Chart Window — explaining what each one does, where to find it, and how to customize it to fit your workflow.
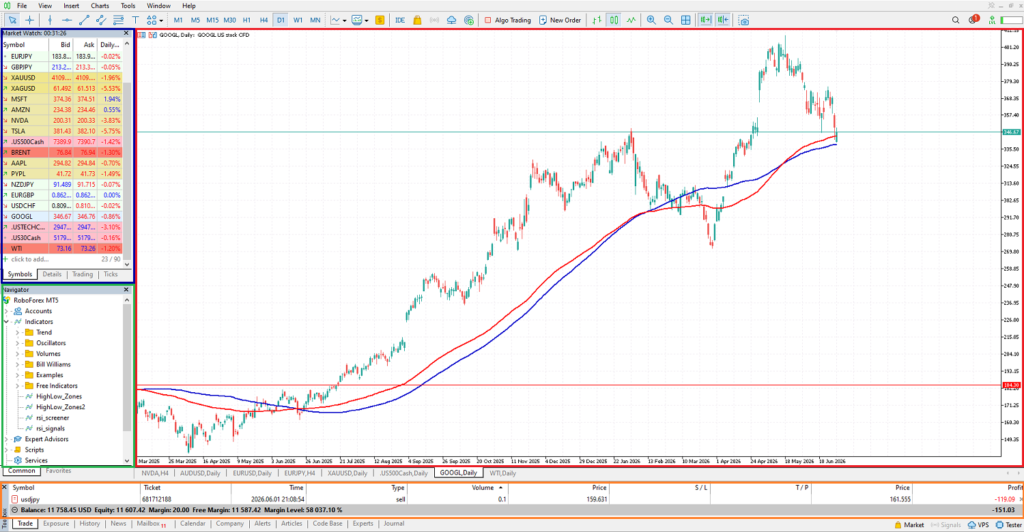
- Blue box: Market watch
- Green box: Navigator
- Orange box: Toolbox
- Red box: Chart window
The MT5 Layout: A Bird’s-Eye View
MT5’s interface is divided into five main regions:
-The Menu Bar runs along the very top and gives you access to every feature and setting in the platform.
-The Toolbar sits just below the menu bar and contains shortcut buttons for the most common actions — opening charts, placing orders, and switching tools.
-The Market Watch panel occupies the left side by default and lists all available instruments with live prices.
-The Navigator panel sits below Market Watch on the left and organizes your accounts, indicators, EAs, and scripts.
-The Chart Window fills the center — this is where price action is displayed and where you’ll spend most of your time.
-The Terminal / Toolbox runs along the bottom and shows your open trades, account history, alerts, and more.
The Menu Bar
The menu bar at the top of MT5 contains eight menus. You won’t need all of them daily, but knowing what lives where saves time.
File — Open and close charts, connect to accounts, and access platform settings.
View — Toggle panels on and off (Market Watch, Navigator, Terminal, Toolbox). If a panel ever disappears, this is where you get it back.
Insert — Add indicators, lines, shapes, and text directly to your charts.
Charts — Change chart types (candlestick, bar, line), zoom levels, and chart properties.
Tools — Access the Strategy Tester, MetaEditor (the MQL5 coding environment), and global platform Options.
Window — Manage multiple open chart windows — tile them, cascade them, or switch between them.
Help — Opens the MT5 documentation and user guide.
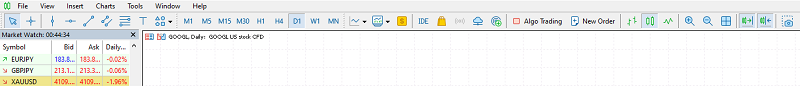
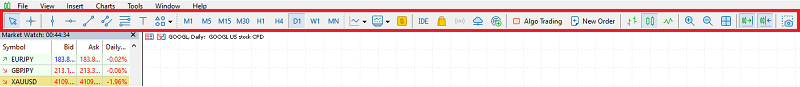
The Toolbar
Directly below the menu bar, the toolbar is a row of icon buttons organized into groups. Hovering your mouse over any button reveals its name. The most important groups are:
Standard toolbar — New chart, zoom in/out, crosshair tool, and the Experts (EA) on/off toggle.
Charts toolbar — Switch between candlestick, OHLC bar, and line chart types. Also controls timeframe selection (M1 through MN).
Line Studies toolbar — Horizontal lines, trend lines, channels, Fibonacci tools, and text labels for annotating charts.
Periodicity toolbar — A visual row of all 21 timeframe buttons, from M1 (1 minute) up to MN (monthly).
You can right-click on any empty area of the toolbar to customize which toolbars are visible.
Panel 1: Market Watch
How to open it: View → Market Watch, or press Ctrl+M
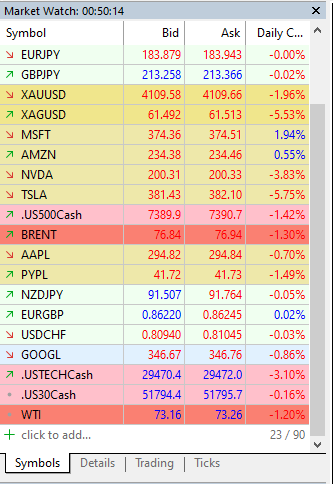
The Market Watch panel is your live price feed. It displays every trading instrument your broker offers, showing the current Bid and Ask price updating in real time. When a price rises it flashes green; when it falls it flashes red.
Key features of Market Watch
- Searching for instruments: Click the search icon at the top of the panel or right-click anywhere in the list and choose Symbols to browse the full catalogue of available instruments organized by category (Forex, Metals, Indices, Stocks, etc.).
- Showing/hiding columns: Right-click on the panel and you can add extra columns: High, Low, Time, Spread, Volume, and more.
- Opening a chart from Market Watch: Simply double-click any instrument in the list to open a new chart for that symbol. Alternatively, drag the symbol directly onto an existing chart to change its instrument.
- The “Tick Chart” tab: At the top of the Market Watch panel, switch to the Tick Chart tab to see a live visualization of every price tick for the selected instrument — useful for seeing micro-level price movement.
- Managing the symbols list: Right-click → Show All to display every instrument your broker offers. Right-click a specific symbol → Hide to remove instruments you don’t trade and keep the panel clean.
Panel 2: Navigator
How to open it: View → Navigator, or press Ctrl+N
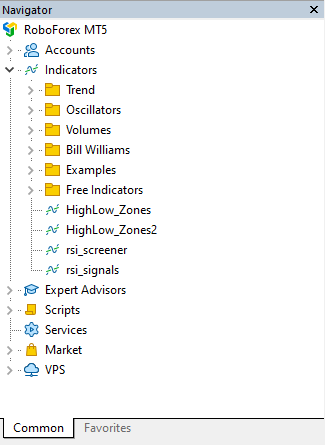
The Navigator is a tree-style panel that organizes all the resources available to you in MT5. It has five main branches that you can expand and collapse:
Accounts
Lists all trading accounts you’ve logged into. A gold star marks your currently active account. Right-click any account to switch to it, open its properties, or log out.
Indicators
Contains all technical indicators available to you — both MT5’s 38 built-in indicators and any custom indicators you’ve installed. They’re organized into subfolders: Trend, Oscillators, Volumes, Bill Williams, and Custom. To apply an indicator to a chart, simply double-click it or drag it onto the chart window.
Expert Advisors (EAs)
Lists all automated trading robots installed on your platform. An EA appears in this folder once you’ve built it or downloaded it. To attach an EA to a chart (and start running it), drag it from the Navigator onto the desired chart.
Scripts
Single-run programs that perform a specific action once — for example, closing all open trades, or setting all chart templates at once. Drag onto a chart to execute.
MQL5 Community Signals
Displays trading signals from the MQL5 community marketplace that you can subscribe to for copy trading.
Panel 3: The Chart Window
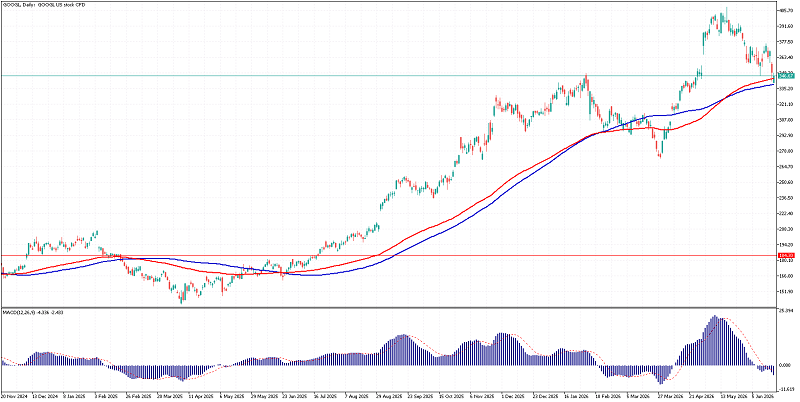
The Chart Window is the heart of MT5. It’s where you analyze price, apply indicators, draw levels, and execute trades. You can have multiple charts open simultaneously, each in its own window or tab.
Chart types
MT5 offers three ways to display price:
- Candlestick chart — The standard for most traders. Each candle represents the open, high, low, and close price for a given timeframe. Bullish candles (price closed higher) are typically white or green; bearish candles (price closed lower) are black or red.
- OHLC Bar chart — Each bar shows the same four prices as a candlestick but in a more compact stick form. Preferred by some professional traders.
- Line chart — Connects only the closing price of each period. Simplest view, best for spotting overall trend direction at a glance.
Timeframes
The 21 available timeframes are grouped into four categories:
- Minutes: M1, M2, M3, M4, M5, M6, M10, M12, M15, M20, M30
- Hours: H1, H2, H3, H4, H6, H8, H12
- Daily / Weekly / Monthly: D1, W1, MN
Switch timeframes using the toolbar buttons or by pressing the corresponding keyboard shortcut (e.g., pressing 1 for M1, 5 for M5, D for D1 on many configurations).
Right-clicking on the chart
The chart context menu is extremely powerful. Right-clicking on any chart gives you instant access to:
- Trading — Place a new order, set a Stop Loss or Take Profit, or close positions
- Indicators — Add any indicator directly from the chart
- Objects — Add drawing tools (trend lines, rectangles, Fibonacci)
- Chart Properties — Change colors, candle styles, background, and grid settings
- Template — Save or load a full chart configuration (indicators + colors + settings) as a reusable template
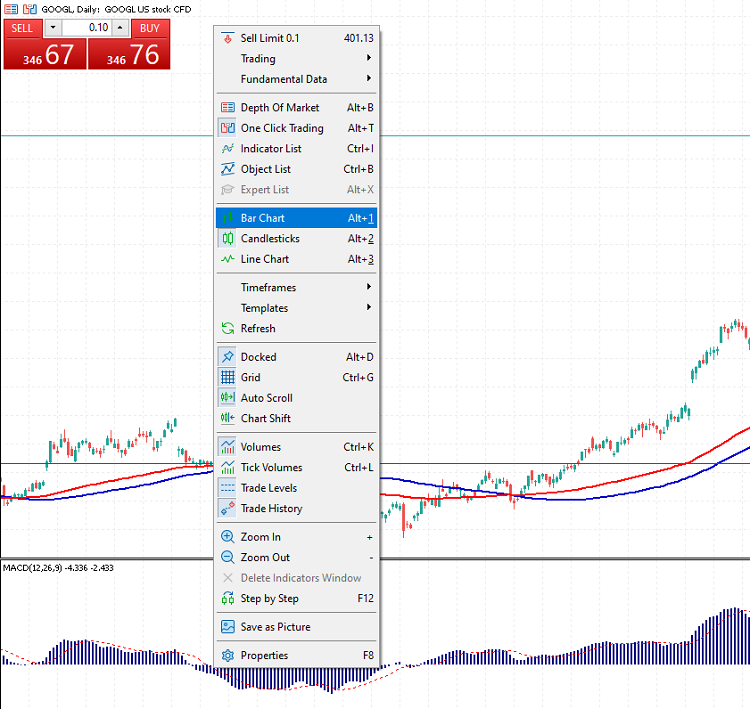
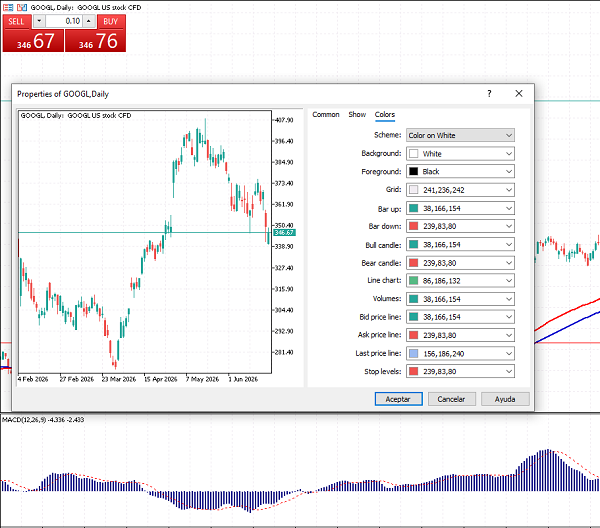
Chart Properties
Double-clicking on any empty area of the chart, or right-clicking → Properties, opens the Chart Properties dialog. Here you can:
- Change the background color (many traders prefer a dark or black background)
- Change bull/bear candle colors
- Toggle the grid, OHLC display, and Ask line on/off
- Enable the “Show trade levels” option, which displays your open trade entry prices, stop losses, and take profits directly on the chart as horizontal lines
Opening multiple charts
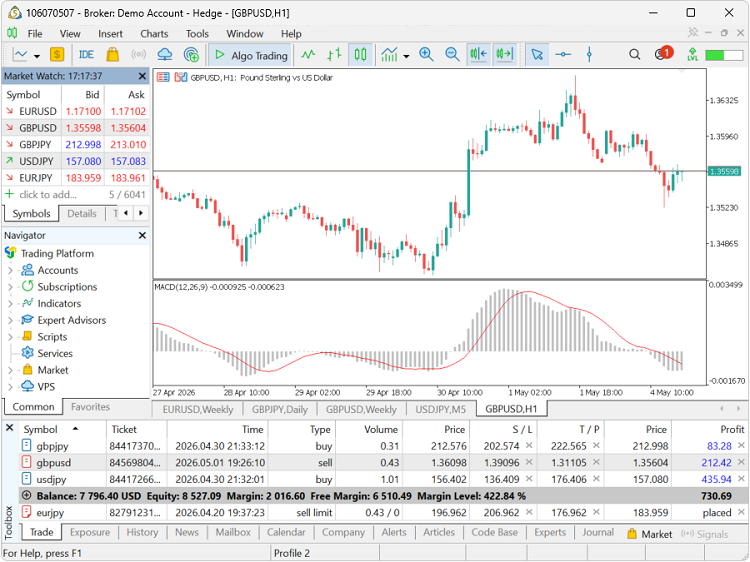
MT5 lets you work with as many chart windows as you need. Go to File → New Chart and select any instrument. You can arrange multiple charts by going to Window → Tile Horizontally or Tile Vertically to view them simultaneously — essential for multi-pair analysis.
📸 Image recommendation #10: A screenshot showing 4 chart windows tiled in a 2×2 grid inside MT5, each showing a different currency pair. This visually communicates the multi-chart workflow that many active traders use daily.
Panel 4: Terminal & Toolbox
At the bottom of the MT5 interface, you’ll find two tabbed panels stacked together: the Terminal and the Toolbox. Press Ctrl+T to toggle the Terminal, and Ctrl+D for the Toolbox.
The Terminal
The Terminal has several tabs, each showing a different aspect of your account activity:
Trade tab — Your currently open positions and pending orders. Shows entry price, current price, profit/loss (both in pips and in account currency), and allows you to close or modify trades directly from here.
Exposure tab — A summary of your total market exposure broken down by asset class and currency.
Account History tab — A full record of every closed trade. You can filter by date range and export the history as an HTML or CSV report.
News tab — Live financial news feed from your broker. Not all brokers enable this.
Alerts tab — Set price, time, or indicator-based alerts that trigger a sound, notification, or email when a condition is met.
Mailbox tab — Internal messages from your broker.
Journal tab — A real-time log of every platform event: connections, disconnections, trade executions, and errors. Invaluable for troubleshooting.

The Toolbox
The Toolbox is MT5’s hub for services connected to the broader MQL5 ecosystem:
Market tab — Browse and purchase Expert Advisors, indicators, and scripts from the MQL5 marketplace. Thousands of free and paid products are available here.
Signals tab — Browse copy-trading signals. Subscribe to a professional trader’s signals and their trades are automatically mirrored in your account.
Virtual Hosting tab — Rent a MetaTrader Virtual Private Server (VPS) from MetaQuotes to run your EAs 24/7 without keeping your computer on.
MFCA tab — MetaTrader FinTech Catalog of apps — a newer extension marketplace.
Customizing Your Workspace
One of MT5’s greatest strengths is how customizable it is. Here are the three most impactful customizations to make early:
Save a Chart Template: Set up your chart exactly how you like it (colors, indicators, timeframe) then right-click → Template → Save Template. Name it something like “My Setup” and apply it to any new chart instantly with a single click.
Rearrange the panels: All MT5 panels are dockable. You can drag Market Watch, Navigator, or the Terminal to any edge of the screen — or undock them entirely as floating windows. Experiment until you find a layout that feels natural.
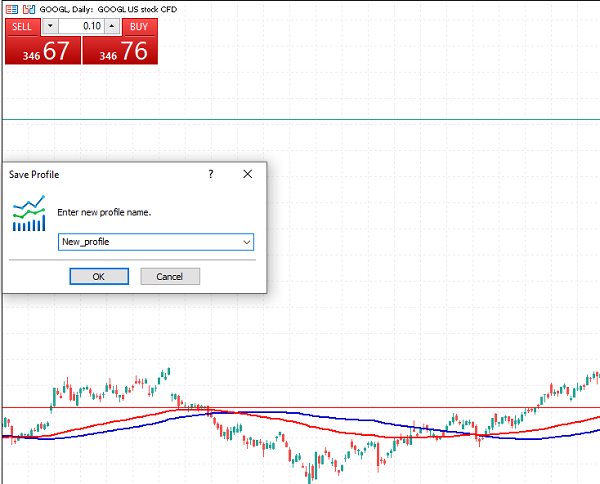
Create a Profile: A Profile saves the entire state of your workspace — which charts are open, which instruments, which timeframes, and which indicators. Go to File → Profiles → Save As to save your current setup. Profiles let you switch instantly between different trading setups (e.g., a Forex profile, a stocks profile, a news-trading profile).
Quick-Reference Keyboard Shortcuts
| Action | Shortcut |
|---|---|
| Show/hide Market Watch | Ctrl + M |
| Show/hide Navigator | Ctrl + N |
| Show/hide Terminal | Ctrl + T |
| Show/hide Toolbox | Ctrl + D |
| New chart | Ctrl + W |
| Zoom in | + (numpad) |
| Zoom out | – (numpad) |
| Scroll chart left/right | Arrow keys |
| Open new order | F9 |
| Open Strategy Tester | Ctrl + R |
| Open MetaEditor | F4 |
| Chart Properties | F8 |
Conclusion
The MT5 interface is dense at first glance, but it’s deeply logical. Market Watch feeds you live prices. Navigator gives you access to your tools. The Chart Window is your analysis workspace. The Terminal and Toolbox keep you informed and connected to the wider trading ecosystem.
Spend 15–20 minutes just clicking through every panel, opening charts, right-clicking, and exploring menus without placing any trades. Familiarity with the interface is the foundation everything else is built on.
In the next article, we’ll put the Chart Window to real use — learning how to read candlestick charts, switch timeframes strategically, and apply your first technical indicators.
Next up: Working with Charts in MT5: Candlesticks, Timeframes & Technical Indicators →
I am Raúl Canessa, the founder of Forexdominion.com. As an experienced Forex trader, my passion for investing and algorithmic trading has shaped my professional journey. Over the years, I have dedicated myself to refining my skills in the financial markets, allowing me to share my knowledge and insights through my platform. I am committed to helping others understand the world of trading and develop effective strategies for success in this exciting field.


