Three Line Break charts were invented in Japan and are similar to Renko and Point & Figure charts. One trader from Japan described Three Line Break charts as a “more subtle form of Point & Figures charts, where reversals of price direction are decided by the market and not by arbitrary rules”. One of the most notable features of these charts is that they are time-blind and only change when closing prices move by a certain number of points higher or lower.
These charts show a series of vertical lines (or “blocks”) of varying size (Renko charts uses a fixed block size). Green blocks (traditionally white) represent rising prices, while red blocks (traditionally black) portraying falling prices. The blocks continue in the same direction until a price reversal is warranted.
A price reversal occurs when the closing price exceeds the high or low of a certain number “X” of previous vertical lines (X is determined by the trader). Traditionally, 3 is used for “X”. This indicator offers the option to change the value of X which gives it more flexibility in analyzing the price action.
Due to their characteristics, especially the fact that they do not take into account the time factor, the Three Line Break charts are a tool that can be very useful to analyze price behavior, especially in combination with more traditional approaches.
The problem with Three Line Break charts, as with other market analysis tools developed in Japan and that are little known, is that they are not found in the most common trading platforms, such as Metatrader 4. This makes it difficult to apply strategies based on these charts.
Therefore, below we include a link to download a custom indicator for Metatrader 4 that displays Three Line Break charts as shown in the following image:
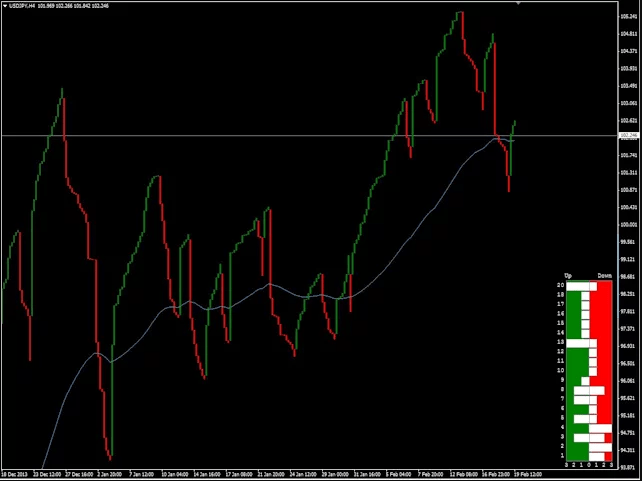
This indicator is called Line Break Chart MT4.
Using the Line Break Chart MT4 indicator
In this case we do not include the indicator itself for download, but at the end of the article there is a link to the webpage where you can download it at no cost. Once the trader has downloaded the indicator he must do the following:
- To view the Three Line Break chart, modify the main chart window to show a line chart and then change the Chart color to “None” in the properties box (it appears when you press F8). When scrolling, zooming in/out or changing the chart currency pair/time frame the indicator will resize the blocks on the next tick to fit the main viewing area of the chart.
- In the indicator parameters, you can modify “X“, that is, the number of vertical lines whose maximum or minimum must be exceeded to draw another line. The default value is 3.
Also, optionally, a “sequence frequency” histogram is displayed. The histogram shows the frequency distribution of the number of sequential highs and the number of sequential lows that have been generated in the last “X” directional changes of the market. The histogram is a beneficial way to visualize whether a pattern of consecutive highs or lows is dominant.
Notes:
- Do not use standard / custom indicators with Three Line Break charts, as indicators are calculated using standard historical data from MetaTrader 4 and are not relevant for Three Line Break.
- The date and time at the bottom of the graph is not a reflection of the current time for each block.
- MT4 Build 600 (or higher) is required to use this chart.
To use this tool on the Metatrader platform you can enter the following site and download it at the following link:
-Three Line Break Indicator MT4
I am Raúl Canessa, the founder of Forexdominion.com. As an experienced Forex trader, my passion for investing and algorithmic trading has shaped my professional journey. Over the years, I have dedicated myself to refining my skills in the financial markets, allowing me to share my knowledge and insights through my platform. I am committed to helping others understand the world of trading and develop effective strategies for success in this exciting field.


