What is the DPO indicator?
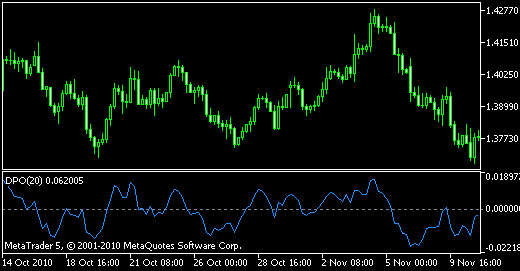
The Detrended Price Oscillator, also known by its acronym DPO, is an indicator used in technical analysis which is designed to provide information on the price of an asset taking into account market fluctuations in the short-term but no in broader movements in the medium and the long term. This indicator eliminates the effect of the market movement trend. This simplifies the process of determining cycles and overbought / oversold levels.
In other words, we can say that the DPO does not take into account the price trend and focuses on fluctuations in the trend. The Detrended Price Oscillator is calculated by subtracting from the current closing price the value of the simple moving average of n days or periods. n (the period for the moving average) is calculated by dividing the period chosen between two and adding one.
For example, the calculation of the DPO (20) in a daily chart is the following:
- Period= 20 days
- Moving Average Period = (20 / 2) + 1 = 11
- DPO = Current close – SMA (11)
The overbought / oversold levels in the DPO come from the history of the asset behavior.
Interpretation of Detrended Price Oscillator
Buy signal
- When the DPO crosses the zero line upwards.
- When the DPO is in a confirmed oversold zone, which is proved by the presence of a number of previous low (minimum) of the oscillator, and both the indicator and the price break upward the downtrend line that acts as a resistance.
Sell Signal
- When the DPO crosses the zero line downwards.
- When the DPO is in a confirmed overbought zone, which is proved by the presence of a number of previous high (maximum) of the oscillator, and both the indicator and the price breaks downward the rising trend line which acts as a support.
I am Raúl Canessa, the founder of Forexdominion.com. As an experienced Forex trader, my passion for investing and algorithmic trading has shaped my professional journey. Over the years, I have dedicated myself to refining my skills in the financial markets, allowing me to share my knowledge and insights through my platform. I am committed to helping others understand the world of trading and develop effective strategies for success in this exciting field.

 Indicator")


 - Definition and Signals")
