According to recent studies on a universe of tens of thousands of graphic patterns (27,000), the chance of a pullback occurring after a support breakout is approximately one in two.
Going into more precise details, these studies indicate that the probability of occurrence of a pullback is 57%. That is, in 57 out of every 100 support breakouts, the price will return to the broken support in the following 30 days (obviously, in 43% of cases, this return will not occur).
In addition, we can estimate that the price will drop during the 5 days after the breakout. Of course, all these data are averages, as you can guess. It does not mean that, after all the support breakouts, the market will drop just for 5 days.
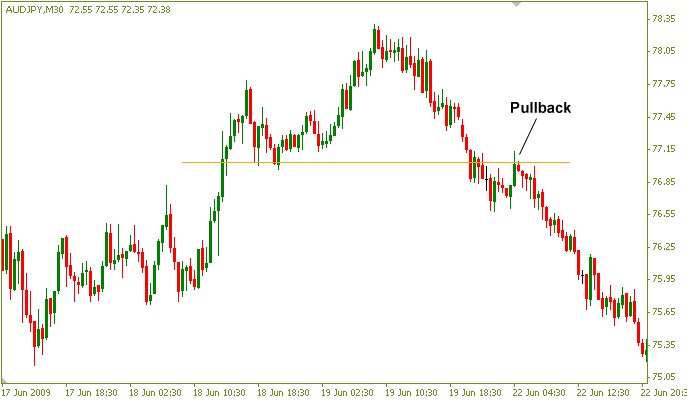
But there are other interesting facts in the study, apart from these. For example, it is explained that, after the breakout, the maximum (average) fall that prices usually reach is -9%. Likewise, 10 days after said breakout, the price returns to the initial point (to the broken support).
We have to mention that this data of -9% seems quite interesting to us since some strategies can be proposed playing with it. That is, we can decide to start a trade after a support is broken and proceed to close the position when we see that -9% is reached (or when the market is near this level.). This would ensure a high hit rate.
Continuing with the study, it also indicates that, after completing the pullback, in 55% of cases (that is, in just over 1 in 2 pullbacks), the price will continue with the downward trend started with the breakdown. Therefore, this tells us that the pullback does not anticipate either the continuity of the market falls or the end of the downtrend.
Taking into account all this information provided by the study, we can draw up a graph of what an “average” Pullback would look like, to visualize all the mentioned elements. With the blue horizontal line, we want to highlight the situation of the support which generates the entire subsequent process.

As we see, at one point, the price (red line) pierces the support for the first time. Next, we would have 5 days of falls, where the price ends up reaching a minimum located -9% below said support.
Subsequently, we would have another 5 days of rise, so that, 10 days after the start, the price returns to the breakout point again. Then, after a raid above the support, the declines would resume, so that it would even fall below the previous minimum (established -9% below the breakout level).
The truth is that the analysis of this “average Pullback” can give us many ideas for the preparation of various strategies that can take advantage of each of the elements that make it up. For our part, we are going to think about whether we can incorporate any of these conclusions into our systems.
This is more or less the summary of the most relevant points mentioned in the indicated studies. We hope that everything described in the post can be useful to you in your daily trade. We are convinced that there will be some idea that can help you in the future.

