Two of the most basic concepts in the technical analysis of the financial markets are both the resistances and the supports. And when we talk about basic concepts we mean that they are very simple to understand and at the same time they are one of the pillars on which the technical analysis is based. First of all, we are going to define what is support and what is resistance.
- Resistance is defined as a level or price above the current price at which the selling force will stop and eventually exceed the buying force so that it puts an end to the bullish momentum. This causes the price to begin to fall and even to reverse the upward trend. In a price chart like the one shown in the following figure, the resistances can be identified as previous peaks reached by the price before falling. In an upward trend, the resistances can be visualized as increasing highs.
- The concept of support, on the other hand, is opposite to that of resistance. Support is defined as a level or price below the current price in which the buying power equals and eventually exceeds the selling power so that the bearish momentum is stopped and this will cause the price to rise and even the bearish trend could be reversed. Generally, in a price chart, the supports can be identified as minimums reached before the price starts to rise. In a bearish trend, the supports can be identified as increasingly lower minimums.

The relative strength of support and resistance levels
Some experts and analysts use a classification of resistances and supports that divide these levels into strong, medium and weak. However, there is some controversy about the validity of this classification as it is often somewhat subjective. However, there are some criteria on which most analysts agree to determine the level of strength of a resistance or support. Here are the criteria:
- A resistance or a support is considered strong depending on how many times it has been tested for the price without having been crossed definitively. In other words, if a resistance or support level has been touched many times by the price without been crossed, then that level can be considered stronger than the one that has endured less time after having been tested by the price.
- A level of resistance or support is strengthened as the prices move away from it after it has been tested. For example, if the price moves away 10% with respect to a resistance or support, it is considered that this level is stronger than another one from which the price moves away only 5%.
- The greater the time a resistance or support has been in force, the stronger it is. For example, a resistance that has been in force for 2 years is considered stronger than a resistance that has only a few days of existence.
The trend and its relation to resistance and supports
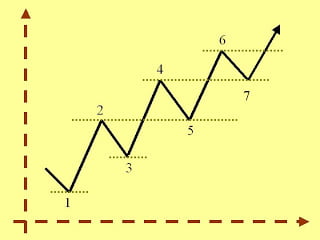
When we analyze trends in the price charts, we can see that a trend consists of a series of valleys and ridges that are produced by price movements. Thus in an upward trend, there is a series of successive crests and valleys increasingly higher, which means a succession of resistance and support ever higher.
When the market is in an uptrend, resistance levels represent pauses or rest areas on the upward path, which temporarily stopped the price action but are unable to do so permanently. For an upward trend to continue, the price is required to exceed the previous resistance level, so that it reaches a new maximum as shown in Figure 2.
Each time the price test a previous maximum, the uptrend is in a critical period during which it may occur that the price does not exceed the previous resistance, which indicates a sign of weakness in the main current uptrend. Likewise, the successive minimum must be higher than the previous minimum. If the asset price falls and reaches the previous support, this constitutes a sign of weakness in the trend. Finally, if the price falls below the previous support level, it is likely that we are seeing a trend change from bullish to bearish trend as seen in Figure 3.


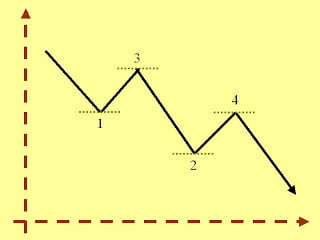
When the market is in a downtrend, we can say that the behavior is equivalent to that seen in an uptrend. A downward trend is formed by a series of successive support and resistance which are increasingly lower.
In this case, the support levels represent pauses or rest areas in the downward movement, which temporarily stopped the price action but are unable to do so permanently. For a bearish trend to continue, it is necessary that the price exceeds the previous support level, so that it reaches a new minimum as seen in Figure 4. Likewise, the successive maximum must be lower than the previous maximum.
Each time the price test a previous minimum, the downtrend is in a critical period during which it may occur that the price does not exceed the previous support, which indicates a sign of weakness in the main current downtrend. If the asset price rises and reaches the previous maximum, this constitutes a sign of weakness in the trend.
Finally, if the price rises and exceeds the previous resistance level, it is likely that we are seeing a trend change from bearish to a bullish trend.

Changing roles of support and resistance during the changes in trends
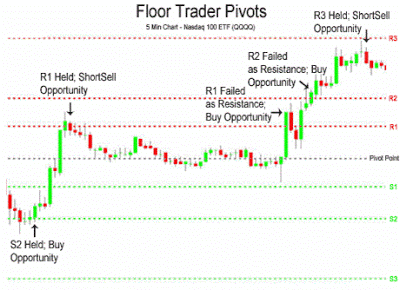
So far we have defined the resistances and supports as maximum and minimum levels in market prices. But one of the most interesting properties of support and resistance is that once they have been crossed significantly by the price, they change at the same time their role or function completely, transforming into its opposite.
This means for example that once it has been confirmed the breakout of a resistance, this resistance will change its function and become a support during successive reversals of the market. Likewise, a support that has definitely been crossed by the price will change its role, and thereafter it will behave as a resistance during the following upward movements or impulses.
It is important to keep in mind that the stronger a resistance has been, the stronger it will be considered as a support after being crossed by the price. The same can be said with respect to a support that has undergone a breakout. In order to better understand the role changes of resistances and supports, the following images can be analyzed (Figures 5 and 6).


Breakouts of supports and resistances
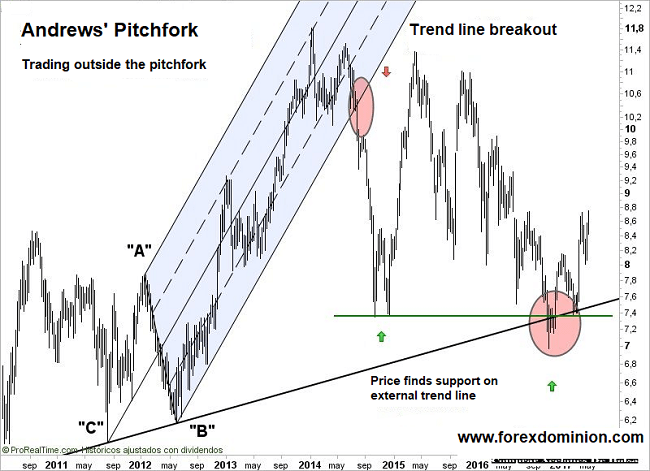
There is much talk about breakouts and significant price penetrations of resistance and support, in fact, many experienced investors usually trade using simple trading strategies that are based on these phenomena. However, we can say that there is a degree of ambiguity or uncertainty about what is really a significant breakout of these levels. For this reason, on many occasions, we are facing what seems to be a significant breakout of a support or resistance only to see that soon the price return to the price level that has been broken and even change the current trend. This is known as a false breakout. There are many times when a trader is caught in such a situation which can cause high losses. However, there are certain criteria that we can apply to analyze a breakout among which we highlight the following:
- Volume criterion: It is based on the well-known Dow Theory and states that trading volume should increase as the asset price breaks and moves above the resistance or below the support. If you notice that the volume starts to decrease as the breakout occurs, probably this is an unreliable breakout with little force and of short duration which should not be used to enter the market.
- Percentage criterion: The skilled trader often use a certain percentage to determine if a resistance or support has been effectively broken. For example, for very significant levels, this percentage should be 3%. In case you are in an uptrend, the asset price must overcome the resistance level by 3% to be deemed to have been crossed. In this case, we can assume that there has been a change in role (the resistance is now a support). Likewise, in a downtrend, the price should fall 3% below a support level to be considered as a significant breakout with the corresponding change of role (the support is now a resistance). In volatile and dynamic markets (in which price movements are more pronounced), usually, the percentage used to validate a breakout is 5% or more, which of course depends on the case.
- Daily close criterion: It is considered that a breakout is valid if the price closes above (below) the level of resistance (support) which has been exceeded by the price in a given period. If we apply the Dow Theory (for medium and long term movements), the intraday breakouts are not considered. According to this theory, only the daily closing prices are considered valid, however, its principles can also be extended to weekly and even monthly closures used by long-term studies of the market. In fact, the criterion of the closing prices can be applied to any time frame, but the trader should consider the period used to analyze the market and the closing price that occurs during this period after crossing through a support or resistance.


