The rectangle is a trend continuation pattern and consists of a price formation in which demand and supply are apparently balanced for a certain period of time. The price moves in a narrow range where it finds a support at the bottom of the rectangle and a resistance at the top of the figure.
Finally, the price ends up breaking out the rectangle range, either through support or resistance. If the previous trend was bullish, then the breakout is most likely to be bullish, but if the previous trend was bearish, the move will most likely be bearish.
However, the rectangle can also be a reversal trend pattern, for example if the previous trend was bullish and the pattern breakout occurs on the downside or when the previous trend was bearish and the price breaks through resistance.
The rectangle pattern has the following appearance:
This formation can be easily identified by two parallel lines (“The upper end of the range” and “The lower end of the range”)
In summary, the rectangle is a graphic pattern that represents a market in range or in the consolidation stage. At this stage, buyers and sellers are at odds with neither group taking control of the market. When the price approaches resistance, sellers push and bring the price down. When the price approaches support, buyers take action and push the price up again. During this stage some agile traders are able to profit from the situation by buying close to support and selling close to resistance.
There comes a time when buyers or sellers are exhausted and leave the market control to the other group whose strength will now be enough to break the range area marked by the rectangle and lead the market in its direction.
How can we trade with the rectangle pattern?
The best practice when trading with the rectangle is to do it in the direction of the main previous trend as follows:
- If the previous trend was bullish, you should wait for the bullish breakout to occur, after which a buy position is opened when the price closes above the upper resistance line.
- A stop loss is placed a few pips below the lower support line.
- If the previous trend was bearish, you should wait for the bearish breakout to occur, after which a sell position is opened when the price closes below the lower resistance line.
- A stop loss is placed a few pips above the upper resistance line.
Usually during the rectangle development the trading volume decreases, typical of the range markets, while the volume increases considerably during the pattern breakout, if it is valid and not a false breakout, giving greater reliability to the buy or sell signal given by the rectangle breakout.
There is a rule that can serve the technical analyst as a “clue” to what the price will do. If the increases occur with high volume and the falls with little volume, the price will surely end up breaking the pattern upwards. On the other hand, if the price increases carry little volume and the decreases experience an increase in volume, the price will surely end up breaking the rectangle below. It is not a mathematical rule, but it usually tends to anticipate the final outcome.
Profit target after pattern breakout
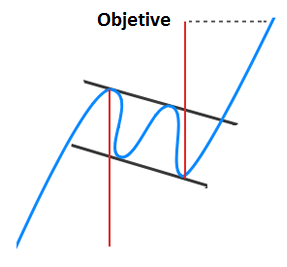
To calculate the projection or target of the price movement after the breakout of one of the two ends of the rectangle, take the height of the rectangle (a line between the support and the resistance) and project it up or down (depending on the movement direction) from the breakout zone. Of course, this does not mean that once the price reaches the end of the projection the trend stops and ends, but rather that it must be interpreted as a first objective. Subsequently, it will be the technical analyst who, by applying other tools, will determine if the trend will continue or can be reversed.
Example of the Rectangle chart pattern

In the example above we see that the main trend on the chart is bearish and after the price crosses the lower support line of the rectangle pattern, the previous previous trend continues in the same direction.


