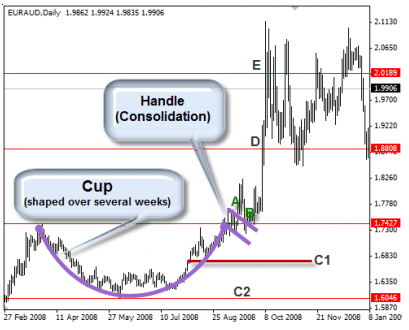
One of the most useful chart price patterns in trading is the the cup and handle pattern. It does not appear very often in the Forex market but when it appears the chances of a good entry are very large. As with many chart patterns, its use is recommended mainly in long-term graphics and not so much in short-term time frames. The cup and handle formation consists of two parts. The first part is a low U-shaped formation that forms the “cup.” After the cup a consolidation period appears that forms the handle, the handle of the cup.
Cup with Handle pattern main features
- Previous Trend: The cup with handle pattern is a graphic trend continuation pattern that indicates a possible continuation of the upward movement. That is, there must be a bullish trend and the pattern formation predicts a continuation of the trend. This trend should not be very mature, since the more mature the trend, the less likely that this pattern will succeed in its forecast of trend continuation.
- The cup: The cup should be formed in a “U” shape and not in a “V” shape, as in other price patterns.
- Cup depth: Ideally the cup recedes up to 1/3 or less of the previous bullish movement. In situations of high volatility a cup with a depth of up to 2/3 of the previous upward movement can be admitted, which is in accordance with Dow’s theory.
- The handle: This part forms the handle of the cup. Its formation is due to a price retracement after reaching the right top of the cup. Sometimes it can form a pennant pattern. The pullback of the handle can reach up to 1/3 of the height of the cup. The smaller the pullback the greater the potential force of the subsequent breakout.
- Handle Breakout: The handle breakout represents the confirmation of the cup with handle pattern and is the signal to open a long position. Sometimes it may be safer to wait for the breakout of the line that joins the maximums that make up the cup, especially if the pullback during the formation of the handle has been wide.
- Volume: Ideally there should be an increase in trading volume during the breakout of the handle.
- Objective: A profit objective can be projected by measuring the distance between the right peak of the cup and its minimum.
As with other price chart patterns, it is more important to capture the essence of the pattern than the smallest details. The cup with handle pattern represents a consolidation of the price when the market finds a resistance represented by the left peak of the cup. During the formation of the cup the market finds a solid support where the price rises until it reaches a resistance and there a small pullback takes place whose rupture gives the exit signal of the consolidation period and the continuation of the previous trend.
I am Raúl Canessa, the founder of Forexdominion.com. As an experienced Forex trader, my passion for investing and algorithmic trading has shaped my professional journey. Over the years, I have dedicated myself to refining my skills in the financial markets, allowing me to share my knowledge and insights through my platform. I am committed to helping others understand the world of trading and develop effective strategies for success in this exciting field.


 Indicator")
