Keltner channels are a technical indicator consisting of three lines: a central line that corresponds to an exponential moving average, and two lines, upper and lower, calculated as a deviation from the central line based on the ATR (Average True Range). If you know the Bollinger Bands you will see that both are similar indicators, with the difference that the bollinger bands use a simple moving average (SMA) as the center line and the bands are calculated as standard deviation of this SMA. In addition, the introduction of the ATR for the bands calculation in Keltner channels gives it the feature of being an indicator based on volatility, as well as being a softer indicator than Bollinger Bands.
Keltner channels, based on an exponential moving average, are a trend indicator, a trend dictated by the inclination of the channel. The most prominent use of Keltner channels as a trend indicator is the identification of trend changes when channel breakouts occur as well as the identification of range phases in the market (flat trend). The areas determined by the upper and lower lines can be used to identify overbought and oversold areas.
The development of Keltner channels is attributed to Chester Keltner who introduced in his book How to Make Money in Commodities (1960) the “Ten-Day Moving Average” rule, considered as the original version of Keltner channels. This original version used SMA instead of EMA. The current version of this indicator is attributed to Linda Bradford back in the 80s of the 20th century who introduced the ATR in the calculation of the channel bands.
Keltner Channel Calculation
The calculation of Keltner channels begins with the calculation of the central exponential moving average, by default of 20 periods. On the other hand, the ATR is calculated, usually of 10 periods. Finally, the value of the ATR multiplied by a value, usually 2, is added to the central EMA, obtaining the two bands of the channel.
- Central line: 20-period exponential moving average (EMA 20)
- Upper channel line: EMA 20 + (2 x ATR 10)
- Lower channel line: EMA 20 – (2 x ATR 10)
The parameters described are the most common in most trading platforms. By increasing the calculation period of the EMA you will get a softer channel that reacts more slowly to the price action and vice versa. On the other hand, as the calculation periods of the ATR decrease, we will have a less constant reading of the ATR, which will produce faster fluctuations in this indicator. And finally, if we modify the multiplier factor of the ATR we will modify the width of the channel. For example, if we vary the multiplier from 2 to 3, the channel width will increase by 50%. In the following image you can see the construction of three Keltner channels with the only difference of the ATR multiplier.

Keltner Channel Interpretation
All channel-based indicators have in common that they are designed to encompass most of the price action. In this way, when the price moves out of the channel (there is a breakout in the channel) a signal is produced indicating that this may be the beginning of a new trend. This is because the trends often begin with strong movements and it will be these strong movements that can cause the channel breakout, signaling the end of the previous trend and the beginning of a new stage with a new direction.
With an exponential moving average as the basis of Keltner channels, it is evident that it is a trend indicator. The direction of the current trend is determined by the inclination of the EMA that gives the same inclination to the channel. Therefore, an ascending channel will be a signal that we are in an upward trend, a descending channel will tell us that we are facing a downward trend and a flat channel will tell us that the market is in a range phase or without a defined trend.
The rupture of the upper line of the channel is a sign of the possible beginning of an uptrend while the rupture of the lower line of the channel may indicate the possible beginning of a downtrend. When the price bounces back and forth from the upper and lower lines of the channel, we are facing a market with no defined trend or range-bound market. This range condition will be reflected by a relatively flat EMA and channel. In addition, areas near the upper and lower lines can be interpreted as oversold and overbought areas.
Comparison of Keltner Channels and Bollinger Bands
As mentioned earlier, the Keltner channels and the Bollinger bands share some similarity but there are two major differences between these two indicators:
- Keltner channels are softer than Bollinger bands: this is because the amplitude of the channel in Bollinger bands is calculated by standard deviation of the center line, a much more volatile calculation than the Average True Range (ATR) used in Keltner channels. Most traders consider this as an advantage since Keltner channels will have a more constant width that makes them more useful for tracking and detecting trends.
- Second, the centerline of the Keltner channels is an exponential moving average (EMA) while in the Bollinger bands it is a simple moving average (SMA). The EMA is much more sensitive to small changes in the price than the SMA which also gives more stability to the Keltner channels
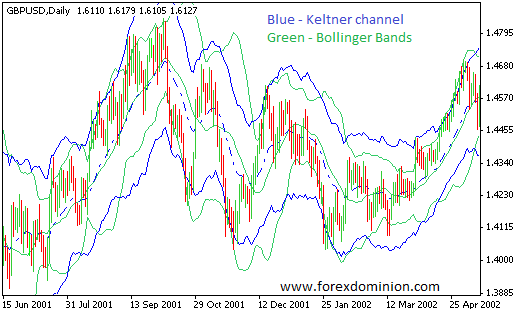
In the following image we can graphically compare Keltner channels and Bollinger bands, clearly observing how Keltner channels are less volatile.
Keltner channels in uptrends
In the following image you can see a price chart of the USD/JPY currency pair in which you can see how the Keltner channels can be used to identify the beginning of an uptrend. The price breaks the upper line of the channel and the inclination of the channel becomes bullish and, in addition, the subsequent lows that are formed are maintained over the lower line of the channel. All this is undoubtedly indicative of an upward trend. The image also shows a market range in which the channel becomes practically flat.

Keltner channels in downtrends
As with upward trends, the Keltner channel can be used to identify downward trends and trade under these market conditions. In the image below you can see a price chart of the EUR/USD pair in which the beginning of a downtrend and the end of the previous uptrend are clearly identified. In addition, it can be seen that during the downtrend the price does not even approach the upper line of the Keltner channel, indicative of a strong downtrend.

Keltner channels are, therefore, a trend indicator designed to identify the prevailing market trend. The use of keltner channels, in combination with other indicators and technical studies, especially momentum oscillators (such as the stochastic oscillator) that show overbought and oversold levels can help find optimal entry levels in the direction of the trend identified with the channels.
You can download a version of this indicator for Metatrader 4 in the following link: Keltner Channel indicator for MT4
I am Raúl Canessa, the founder of Forexdominion.com. As an experienced Forex trader, my passion for investing and algorithmic trading has shaped my professional journey. Over the years, I have dedicated myself to refining my skills in the financial markets, allowing me to share my knowledge and insights through my platform. I am committed to helping others understand the world of trading and develop effective strategies for success in this exciting field.

 - Volatility Indicator")


