Certainly the approaches to trade in the financial markets are numerous and varied. Many traders base their strategies on the fundamentals of supply and demand while others use more technical tools such as moving averages, price oscillators and other. In this article we study an interesting approach based on market momentum interpreted through the RSI indicator.
First of all we will indicate that the markets are indeed driven by changes in supply and demand. However, these changes are not always due to the publication of news and relevant market indicators or related events. Sometimes the markets move in one direction or another due to different factors that can not be predicted by fundamentals, such as a correction when a trend starts to run out. This is where certain indicators such as the RSI can be useful.
However, any experienced trader knows that enter the market based solely on overbought and oversold readings in the RSI and other technical indicators is an excellent way to lose money. A more accurate interpretation of market momentum based on different timeframes is needed to understand the role that small market movements have in the overall context. This is important because usually the slightest movements present opportunities to start trades in the direction of the main trend. This is an approach that can be applied successfully for swing traders.
The RSI indicator
Before analyzing price charts we will briefly explain the momentum oscillator used for this approach. Most traders are probably familiar with the RSI (Relative Strength Index) by J. Welles Wilder. It is an indicator which measure market momentum by drawing a line based on the closing price relative to the price range over N periods elapsed (the default value for N is 14). When the price closes near the top of the range, the indicator goes up and vice versa. Values above 70 or 80 indicate an overbought condition, which is a sign that the strength of buyers are starting to be exhausted, while oversold values below 30 or 20, indicate the possible depletion of the force sellers.
Configuration used in this trading methodology
This approach uses a simple moving average of 13 periods of the RSI (14) to reduce false signals and to see clearly the trend in the momentum and identify signals between the overbought and oversold zones in the RSI.
Rules of the strategy
The rules of this methodology are fairly simple and are discussed below.
Short Positions
The rule states that the trader must open a short position when the simple moving average of 13 periods of RSI reaches the medium level of the indicator at 50 from below in a shorter time frame, while the upward momentum loses strength on the daily chart . This approach can be useful for swing traders with a time horizon of about 2-10 days. The following are two examples with the SPY (SPDR S&P 500 ETF Trust).
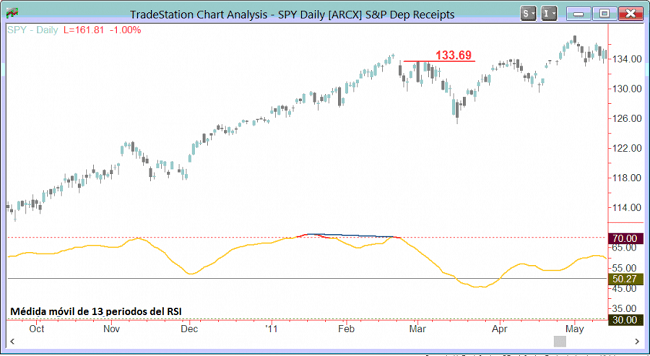
In the price chart above we see that the price has dropped from a peak in February. The daily chart shows a bearish divergence between price and momentum in which the maximum price in February coincided with a lower high in the oscillator, when this indicator was still above 70 in the overbought zone. The pace of price increases began to decline after a major boost. This was a clear initial sign that the uptrend was at risk. Under these conditions it was not advisable to open long positions at that point.
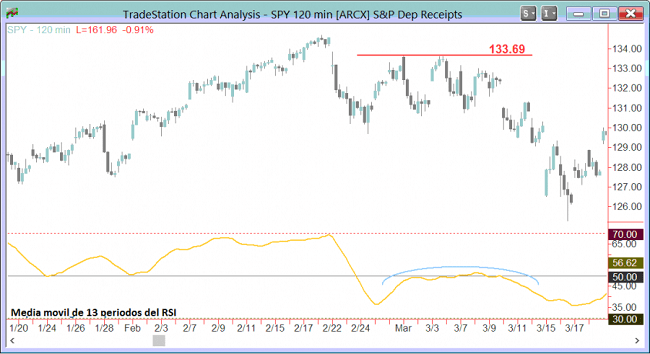
Now let’s analyze a price chart with an interval of 120 minutes, ie a shorter time frame. After a initial period of higher selling pressure from February 22 to 24 in which the price dropped with some force, the SPY recovered and the moving average of the RSI began to move upward. The price peaked at 133.69, which demonstrated that the price momentum was not strong enough to drive the SPY above the maximum of February. At the same time, the indicator formed a flat horizontal line in the middle level 50. Taking into account the loss of momentum in the longer time frame, a stronger momentum in the shortest time frame suggested a countertrend move. The maximum level at 133.69 offered a level to place a stop loss for a short position, with a potential benefit based on the price range in early March which was resolving decidedly downward. Subtracting the maximum from the minimum of the range we gave a measured movement of 127.51, which was a decent start point for the short position.
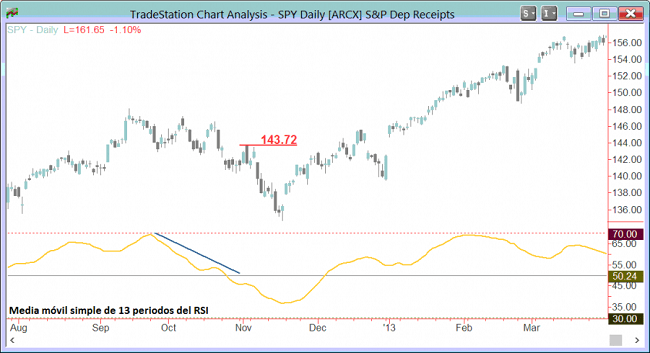
Now let’s see another example in November 2012. In late October, the SPY broke down a range that began to form in mid-September. This was an early sign that the technical structure was weak: any trader who bought when the range was formed was losing money and under pressure to sell in order to limit their losses, as traders who sold since the beginning saw that their market vision was validated, which gave them more confidence to add more positions. In addition, the moving average of 13 days of the RSI (14) was in clear decline.
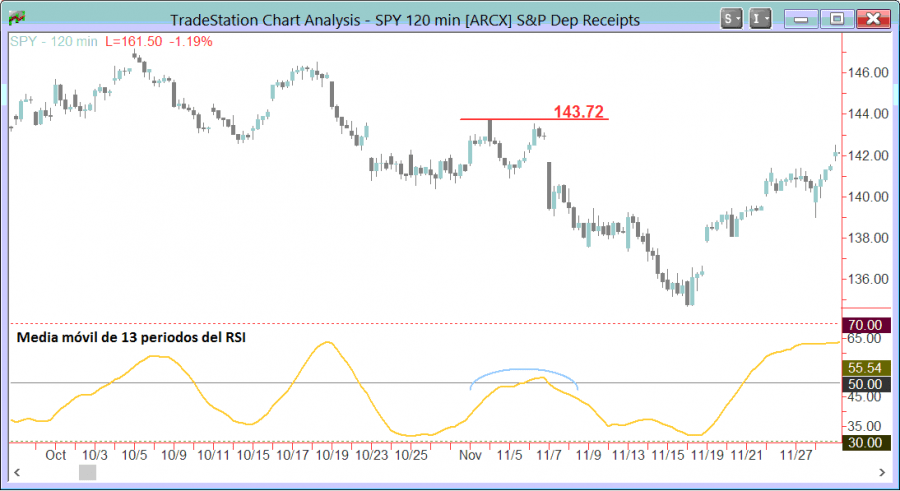
In the previous image we can see a price chart of 120 minutes, ie a shorter time frame. The moving average of the RSI in this chart began to recover in late October and SPY began to rise. But the price increase was completed in the minimum range, which now behaves as a zone to make short traders. A resistance formed in 143.72 and the rise in the indicator began to slow around 50. This was an interesting scenario for opening a short position with a stop loss above 143.72. The potential benefit was measured by counting the movement based on the range, which in this case was 138.00.
Buy positions
The same rule used for short positions applies to buy positions, but in reverse:
The rule states that the trader must open a buy position when the simple moving average of 13 periods of RSI reaches the medium level of the indicator at 50 from above in a shorter time frame, while the bearish momentum loses strength on the daily chart . This approach can be useful for swing traders with a time horizon of about 2-10 days.
Conclusions
This is a methodology that can be useful in any trading strategy repertoire. The market success comes from applying well defined strategies with a decent success rate. The methodologies selected by the trader should be consistent with their view of the market, trading style and personality, because otherwise you will not be able to properly implement them.
You can access more trading strategies for Forex and other markets in the following section: Forex trading systems

