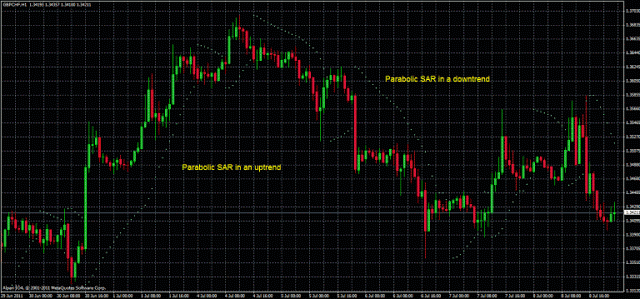
The Parabolic system price/time is another idea that introduced the famous Welles Wilder in his book “New Concepts in Technical Trading Systems“. This system was developed as a high and reversal strategy, which means that a trader using this approach will always have either a buy position or a short position in the market. Here we must remember that when the Parabolic SAR generates a buy signal, for example, a series of bullish points appears below the current price action. As the market moves higher, the indicator points also rise, first slowly and then faster.
When the trend is stopped or begins to reverse, points and prices intersect, in which case a long position is closed and a new short position is open. For this system, we want to determine whether the addition of a volume requirement for Parabolic SAR entry signals can improve the performance of these signals. For example, the buy signal for this system is when a high in price reaches a point of Parabolic SAR above the market with a volume higher than the simple moving average of 5 periods (five bars) of volume. Both conditions must be met in the same bar.
Trading System configuration
- 1 candlestick/bar price chart (Timeframe: 4 hours or daily).
- Parabolic SAR with standard configuration.
- Volume indicator (present in Metatrader 4 and 5) with a simple moving average of 5 periods of the volume.
Rules for buying positions
Rules for short positions
Rules for close positions
- For a buy position, the close occurs when the price begins to fall and reaches the Parabolic SAR in the downward movement.
- For a short position, the close occurs when the price begins to rise and reaches the Parabolic SAR in the upward movement.
- For a buy position, the number of points of the Parabolic SAR below the price action can be used as a trailing stop.
- For a short position, the number of points of the Parabolic SAR above the price action can be used as a trailing stop.
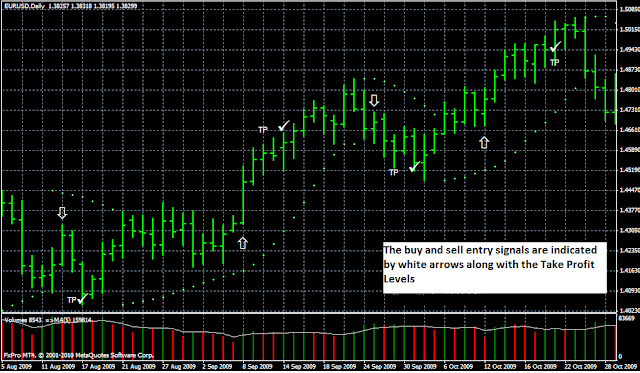
In the picture above we see a daily chart of the EUR/USD in which this trading system was applied. In total, there are two buy signals and two sell signals indicated by white arrows. In all four cases we can see how the Parabolic SAR indicates a turnaround when the price starts to increase/decrease and reaches the point of the indicator, which occurs at the same time when the volume exceeds its simple moving average of 5 periods.
In the four signals it is produced a winning trade with profits (the price reached the target profit taking), however this is not always the case because the system is not 100% foolproof and sometimes produce false signals. Therefore, it is important that the trader apply money management practices.


Easily Boost Your ClickBank Banner Traffic And Commissions
Bannerizer made it easy for you to promote ClickBank products by banners, simply visit Bannerizer, and get the banner codes for your selected ClickBank products or use the Universal ClickBank Banner Rotator to promote all of the ClickBank products.