Price Reversal Trading System with ZigZag and RSI Indicators

The trading system that we are going to present below is a market reversal strategy that uses several modified technical indicators developed for the Metatrader 4 platform. Due to this, this system can only be used on this trading platform. This methodology can be used to trade in most markets, including Forex.

This strategy aims to identify the areas in which the price is likely to change its trend. The modified indicators are based on the well-known Parabolic SAR and Zigzag and a modified moving average is known as the VAR Moving Average, which is used to indicate whether the trend of an asset is reversing. As a filter, we use the RSI indicator.

Because it is a trading system based solely on technical indicators, it has mechanical entry and exit rules and it is quite simple to apply. Therefore, it does not require much interpretation.

As always, it is recommended to test this reversal trading system with a demo account before using it to trade with real money.

Read more

Trading strategy based on the Parabolic SAR and volume

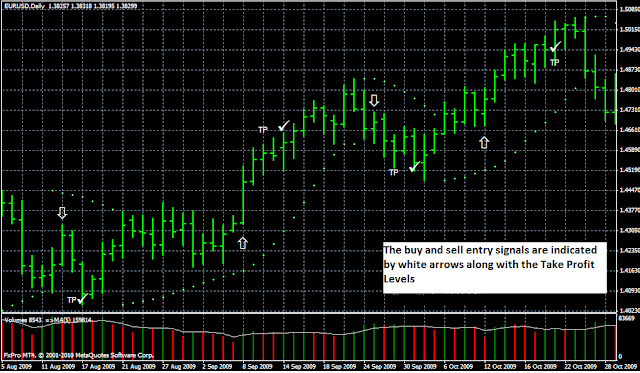
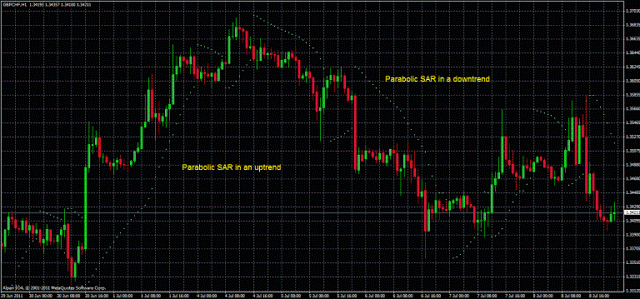
The Parabolic system price/time is another idea that introduced the famous Welles Wilder in his book “New Concepts in Technical Trading Systems“. This system was developed as a high and reversal strategy, which means that a trader using this approach will always have either a buy position or a short position in the market. Here we must remember that when the Parabolic SAR generates a buy signal, for example, a series of bullish points  appears below the current price action. As the market moves higher, the indicator points also rise, first slowly and then faster.

When the trend is stopped or begins to reverse, points and prices intersect, in which case a long position is closed and a new short position is open. For this system, we want to determine whether the addition of a volume requirement for Parabolic SAR entry signals can improve the performance of these signals. For example, the buy signal for this system is when a high in price reaches a point of Parabolic SAR above the market with a volume higher than the simple moving average of 5 periods (five bars) of volume. Both conditions must be met in the same bar.

Read more

The Parabolic SAR – Definition, Use and Calculation

In this article, we will show you how the Parabolic SAR indicator can help you predict the market trend and its oscillations. The Parabolic SAR is another of the stock market technical indicators developed by the legendary Welles Wilder, who published it in his well-known book “New concepts in technical trading systems“, along with the RSI, the ATR, and the … Read more