The Triple Screen trading system was invented by Dr. Alexander Elder in the 1980s, and he first presented it to the public in 1986 in the magazine Futures. Since then, he has been adding small variations to the original system. In this article, we are going to carry out a quantitative analysis by coding it and testing it across several markets.
Philosophy of the Triple Screen Strategy
The Triple Screen subjects every trade to three tests, or filters. Many trades that look attractive at first are later rejected by one of the filters. Trades that pass the Triple Screen test have a much greater chance of success.
The Triple Screen combines trend-following indicators on long-term charts with counter-trend oscillators on medium-term charts. It uses special entry techniques for buying or selling, as well as strict money management rules. The Triple Screen is more than a trading system: it is a method, a style of trading.
Trend-Following Indicators and Oscillators
Different indicators can give contradictory signals in the same market. Trend-following indicators rise during uptrends and give buy signals, while oscillators enter overbought territory and give sell signals. The opposite also holds: in a downtrend, trend-following indicators give sell signals, while oscillators enter oversold territory and give buy signals.
Trend-following indicators are profitable while markets are moving, but they lead systems to losses in range-bound markets. Oscillators are profitable in trading ranges, but they give premature and dangerous signals when markets begin to trend. Traders say: “The trend is your friend” and “Let your profits run.” They also say: “Buy low, sell high.” But why sell if the trend is up? And how high is too high?
The Triple Screen trading system is designed to filter out the disadvantages of trend-following indicators and oscillators while preserving their advantages.
Choosing Timeframes
Another very important dilemma is the fact that the trend of any trading vehicle can be both up and down at the same time, depending on the charts being used.
A daily chart may show an uptrend while a weekly chart shows a downtrend, and vice versa. We need a system to handle contradictory signals across different time horizons.
Charles Dow, the author of the venerable Dow Theory, stated that, at the beginning of the 20th century, the stock market had three trends: long-term trends, medium-term trends, and the shortest ones, called minor trends.
Robert Rhea, the great market technician of the 1930s, compared these trends to the tides, waves, and ripples of water. He recommended trading in the direction of the tide, taking advantage of the waves, and ignoring the ripples.
The Triple Screen trading system is based on the observation that each time horizon is related to the one before and after it by a factor of approximately five.
Choose your favorite trading timeframe; in the Triple Screen system, we will call that the intermediate timeframe. The long-term timeframe is one order of magnitude greater. The short-term timeframe is one order of magnitude smaller. Once you choose your intermediate timeframe, you may not look at it until you have examined the longer-term timeframe and made your strategic decisions from the latter.
The Triple Screen requires that you examine the long-term chart first. It allows you to trade only in the direction of the tide: the trend on the long-term chart. It uses the waves that move against the tide to enter positions. For example, when the weekly trend is up, daily declines create buying opportunities. When the weekly trend is down, daily rallies offer opportunities to sell.
| MINOR CHART | INTERMEDIATE CHART | MAJOR CHART |
|---|---|---|
| 4 Hours | Daily | Weekly |
| 1 Hour | 4 Hours | Daily |
| 15 Minutes | 1 Hour | 4 Hours |
First Filter: The Market Tide
The Triple Screen system begins by analyzing the major chart. For example, if you trade on the daily chart, your major chart will be the weekly.
The original version of the Triple Screen used the slope of the weekly MACD histogram as its trend-following indicator. It was very sensitive and gave many buy and sell signals. Later, he switched to using the slope of an exponential moving average on the major chart as the main trend-following tool on long-term charts.
Using the MACD histogram as the first filter of the Triple Screen requires us to examine the major charts before even studying the intermediate ones. The slope of the MACD histogram is defined by the relationship between its last two bars.
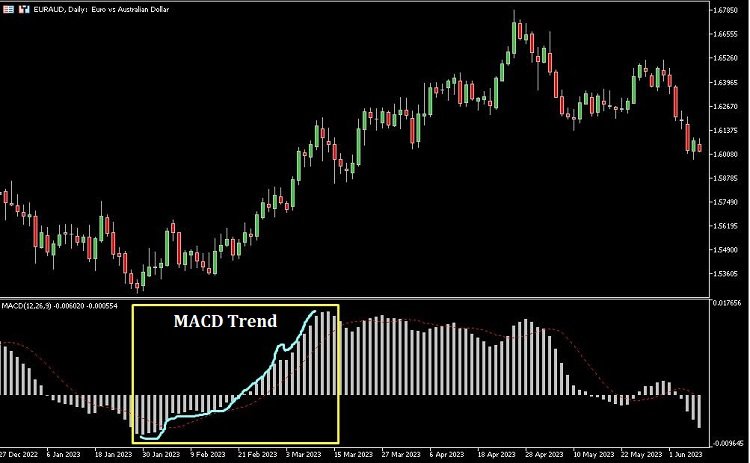
This indicator gives a buy signal when its slope turns positive, and a sell signal when its slope turns negative. The best buy signals occur when the MACD histogram turns upward from below its axis. The best sell signals occur when its slope turns downward from above its axis.
Summary of the First Filter:
Identify the higher-timeframe trend using a trend-following indicator and trade only in that direction. Every trader has three options: buy, sell, or stay on the sidelines. The first filter of the Triple Screen trading system removes one of those options. It acts as a censor, allowing only buying or staying aside during major uptrends, or only selling or staying aside during major downtrends. One must swim with the tide or stay out of the water.
Second Filter: The Market Wave
The second filter of the Triple Screen identifies the wave that moves against the tide. When the major trend is up, declines on the intermediate chart point to buying opportunities. When the major trend is down, rallies on the intermediate chart point to selling opportunities.
Applying Oscillators
Use oscillators on the intermediate chart to identify deviations from the major trend. Oscillators give buy signals when markets decline and sell signals when they rise. The second filter of the Triple Screen allows you to accept only those signals on the intermediate chart that are in line with the major trend.
Second filter: apply an oscillator to your intermediate chart.
Use declines on the intermediate chart during uptrends on the major chart to find buying opportunities, and overbought rallies during downtrends on the major chart to find selling opportunities.
You can use the Force Index as the second filter, but other oscillators also work well, such as the RSI, the Stochastic, or the WPR (Williams Percentage Range), all of which are momentum indicators.
These oscillators signal trading opportunities when they enter their buy or sell zones. For example, when the MACD histogram on the major chart is rising but the Stochastic on the intermediate chart falls below 30, it identifies an oversold area, a buying opportunity.
When the MACD histogram on the major chart is falling but the Stochastic rises above 70, it identifies an overbought area, a selling opportunity.
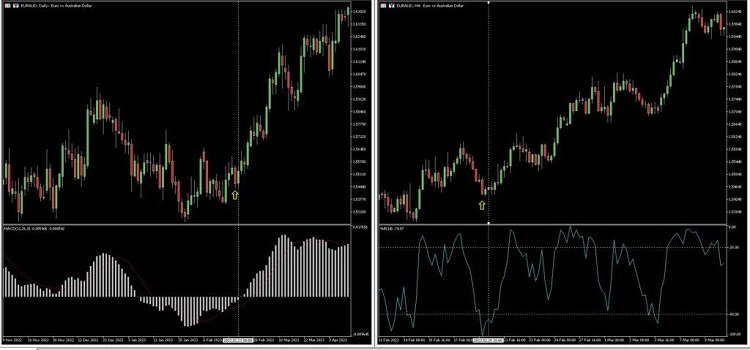
In the image above, you can see a buying opportunity on 02/21/2023: the MACD bars are rising, and on our intermediate chart a bearish session pushes the Williams Percent Range into an oversold zone, allowing us to join the market tide, the uptrend.
Third Filter: Entry Technique
In the original book Come Into My Trading Room, for the Triple Screen system, the author recommended looking for a ripple in the direction of the market tide: buying when price breaks above the previous day’s high to enter long positions, or entering a sale when price falls below the previous day’s low.
The downside of this approach was that stops were quite wide when volatility is high. Buying on a breakout above the previous day’s high, with a stop below that day’s low, could mean a wide stop after a wide-range session, so either a lot of money was exposed to risk, or the position size had to be reduced. At other times, when the day before the breakout was very narrow, placing the stop just below its low exposed the trade to the risk of being stopped out by market noise.
Another entry technique can be an alternative approach to what he called the average EMA (exponential moving average) penetration. It consists of measuring on your main trading chart how far price penetrated the EMA on the last 4 or 5 occasions, averaging those values, and placing a pending order at that level.
Summary of the Triple Screen System
When the major trend is up and the oscillator on the intermediate chart is falling, place a buy order below the EMA of the intermediate chart, at the level of the average downside penetration. You can also place a buy order one tick above the previous day’s high. If prices rally, the stop will be triggered and you will automatically be in a long position when the rally exceeds the previous day’s high.
You can access multiple trading strategies for different markets at: List of Trading Systems
Which broker do we recommend for using this strategy to trade Forex and other markets? Exness is a good option. More information at: EXNess Broker Website

I am Raúl Canessa, the founder of Forexdominion.com. As an experienced Forex trader, my passion for investing and algorithmic trading has shaped my professional journey. Over the years, I have dedicated myself to refining my skills in the financial markets, allowing me to share my knowledge and insights through my platform. I am committed to helping others understand the world of trading and develop effective strategies for success in this exciting field.