Diamonds Chart Patterns Explained
The diamond chart pattern is a very rare and exceptional form of chart formation which looks same like the head and shoulder or an inverted head and shoulder pattern. It is a reversal pattern which appears in a V shape. The diamond patterns will not frequently occur in the market bottoms and it usually takes place during the major top. As these diamonds chart pattern executes as a variant of head and shoulders chart patterns, the traders have to withstand their desire for differentiating the top that resembles a diamond formation. The basic reason for avoiding this pattern is that, the diamonds chart pattern will evoke a break in the trend very sooner when compared to the head and shoulders chart formation.
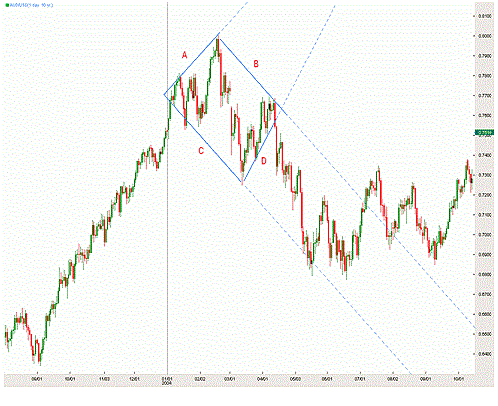
Basically there are two types of diamond patterns: the diamond bottoms which are formed in bearish trends and the diamond tops which are formed in bullish trends. In both cases the pattern is formed by two juxtaposed symmetrical triangles.
Diamond Tops
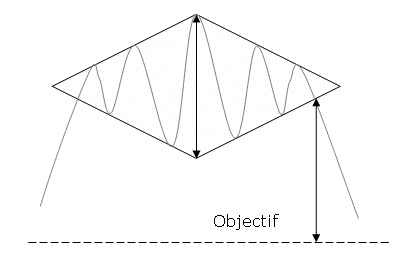
-This formation indicates the shortness of buyers and therefore trader’s indecisiveness in the market. Also, this pattern reflects a growing volatility which will be gradually reduced towards the end of the diamond.
-The price oscillations are of greater amplitude and then begin to decrease which indicates a possible trend reversal. In this case the buyers start losing momentum.
Diamond Bottoms

-This formation indicates the shortness of sellers (the weakening of the sell force) and therefore trader’s indecisiveness in the market. Also, this pattern reflects a growing volatility which will be gradually reduced towards the end of the diamond.
-The price oscillations are of greater amplitude and then begin to decrease which indicates a possible trend reversal. In this case the sellers start losing momentum.
Diamond pattern main features
- The diamond patterns occur infrequently.
- Statistics indicate that there are 3 times more diamond tops compared to diamond bottoms.
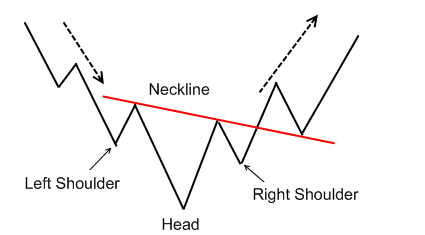
- Sometimes is possible to see and inverted head and shoulders within the diamond bottoms or a normal head and shoulders within the diamond tops.
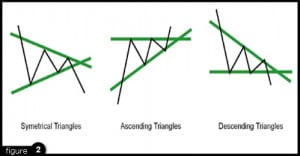
- When the diamond is beginning to form, the formation resembles a widening of a symmetrical triangle pattern. However, the difference is that the diamond is a reversal pattern and the symmetrical triangle a continuation pattern.
Some traders don’t recommend to implement the diamonds chart pattern, as it is quite unusual and not often examined to give results in trading. As in all chart formations, the trading volume at the time of the breakage of the figure is essential to determine the reliability of the diamond pattern.
Example of the Diamond Pattern

