What are Flags patterns?
Flags are chart patterns which occur mainly during the consolidation periods, particularly while the market exists in a tight range. When it comes to flag formation, it has both optimistic and pessimistic interpretation. But this relies upon the currency pair´s trend existing in the market. When the Forex market (or any other financial market) goes up, the bullish flag (descending flag) tends to move downwards and when the market moves down, the bearish flag (ascending flag) will move upwards. Remember, flags and pennants are closely connected and have an extension pattern that will represent a pause over the market dynamics.
These chart patterns are most usually observed after a huge and intense move in the market trends. With a breakthrough in the market, there will be a usual uptrend/downtrend in the market following the same direction. Many potential resources and case study have stated that, the flag chart pattern has proven to be one of the most reliable formations in the charts market analysis.
Flags Pattern Description
-Ascending Flag

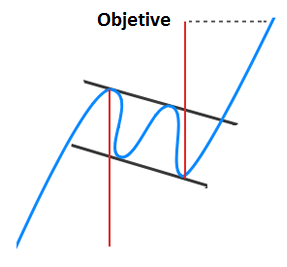
How to trade with the Flags?
The main principles to trade with the flags are the following:
- Always trade this formation in the direction of the previous main trend
- If the previous trend was bullish, the trader must wait for a breakout to the upside and open a long position when the currency pair rises above the upper resistance trendline.
- The stop loss should be placed a few pips below the lower support trendline.
- If the previous trend was bearish, the trader must wait for a breakout to the downside and open a short position when the currency pair moves below the lower support trendline.
- The stop loss should be placed a few pips above the upper resistance trendline.
Example of the Flag pattern

I am Raúl Canessa, the founder of Forexdominion.com. As an experienced Forex trader, my passion for investing and algorithmic trading has shaped my professional journey. Over the years, I have dedicated myself to refining my skills in the financial markets, allowing me to share my knowledge and insights through my platform. I am committed to helping others understand the world of trading and develop effective strategies for success in this exciting field.


Drawing trend lines is one of the few easy techniques that really WORK. Prices respect a trend line, or break through it resulting in a massive move. Drawing good trend lines is the MOST REWARDING skill.
The problem is, as you may have already experienced, too many false breakouts. You see trend lines everywhere, however not all trend lines should be considered. You have to distinguish between STRONG and WEAK trend lines.
One good guideline is that a strong trend line should have AT LEAST THREE touching points. Trend lines with more than four touching points are MONSTER trend lines and you should be always prepared for the massive breakout!
This sophisticated software automatically draws only the strongest trend lines and recognizes the most reliable chart patterns formed by trend lines…
http://www.forextrendy.com?kdhfhs93874
Chart patterns such as "Triangles, Flags and Wedges" are price formations that will provide you with consistent profits.
Before the age of computing power, the professionals used to analyze every single chart to search for chart patterns. This kind of analysis was very time consuming, but it was worth it. Now it's time to use powerful dedicated computers that will do the job for you:
http://www.forextrendy.com?kdhfhs93874