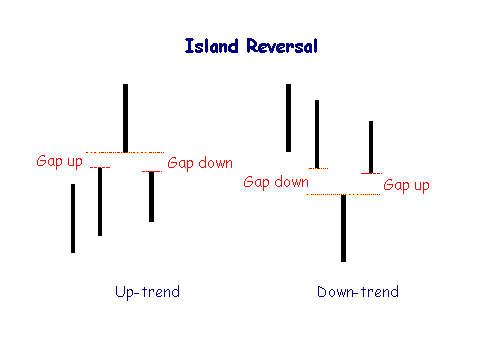
Description of the Island Reversal
Island reversal is a trend change pattern which forms a gap on both sides. This chart pattern is most likely shown when the market trend proceeds to its last level. The name island reversal is obtained from the fact which the candlestick appearing alone, that is quite alike in the island. This chart pattern explains an increase in the volume amidst the primary gap and the following gap proceeding in the opposite direction.
The island reversal pattern is driven across the pre-market trading and pro trading as well. Generally, the island reversal chart pattern is described as a distinct trading activity that works within a range and moreover it is separated with a move. The separation is resulted due to an exhaustion gap and the opponent direction results with a breakthrough gap.
Island reversal formation describes the subsequent move that happens with a breakthrough gap. The reversal could happen even in the peak or even like the head and shoulder formation too. For instance, consider that the rate of the USD/JPY go higher and attains around 84 USD and it opens with a range of 85 USD in the succeeding week and doesn’t fall down in its opening. At the closure of the day, the rate will uptrend higher and attains 87 USD and closes with 86.60 USD.
As per the examination, there remains a gap with 100 pips that remains unfilled. In the succeeding market trend, when the rate open with $86.40 and it further hits the rate close to $87.90 and then the closing rate of the market will close to be $87. May be after a couple of weeks or in the succeeding weeks, the rate will open with $84 and the closure rate will be around $82.90. As per the technical analysis made, you could find isolation occurred in the chart. This is called as island reversal.
Bullish Island Reversal
- It appears at the end of bear markets and causes an upward correction.
- It is formed when one or more of the chart bars are cut by a hole or gap in the front and the back. It responds to a panic in the market of the sellers which cause a series of jumps in the price due to nervousness. This causes the price to fall heavily, but after a while it produces the opposite effect and the buy positions accumulate which such force that the market jumps a series of prices again but this time upwards
Bearish Island Reversal
- It appears in bull markets and at the end causes a downward correction.
- It is formed when one or more chart bars are cut by a hole or gap in the front and the back of the bars.
- This formation responds to a time of market euphoria that produces a series of jumps in prices caused by an increasing buying force which rapidly increases the market quotes. However, after a while it produces the opposite effect and the short positions accumulate to the point of causing jumps in the price but in bearish direction.
Example of the Island Reversal Pattern

I am Raúl Canessa, the founder of Forexdominion.com. As an experienced Forex trader, my passion for investing and algorithmic trading has shaped my professional journey. Over the years, I have dedicated myself to refining my skills in the financial markets, allowing me to share my knowledge and insights through my platform. I am committed to helping others understand the world of trading and develop effective strategies for success in this exciting field.


eToro is the ultimate forex trading platform for beginner and established traders.