The Quantitative Qualitative Estimation indicator (abbreviated QQE) is a mystery since nobody currently knows who its author is. Originally designed to create an indicator that is capable of signaling the trend while detecting overbought and oversold levels, the QQE consists of a smoothed version of the RSI on which two dynamic levels are calculated (Fast Trailing Level and Slow Trailing Level ). To obtain these levels we must follow the following steps:
- First, the ATR of n periods of a smoothed RSI is calculated using an exponential moving average (here we must understand the ATR as the difference between the current value and the value of the previous period).
- The resulting ATR is then smoothed with a smoothed Wilder mean (that is, a WMA), also of n periods. For those who don’t know, a WMA of n periods is equivalent to an EMA of 2n-1 periods.
- The resulting value in the previous step is multiplied by two multipliers to obtain the fast and slow levels.
The following values are generally used as indicator parameters:
-14 for RSI
– 5 for the smoothing moving average of the RSI
– 27 for the two smoothed ATR values
-While 2,618 and 4,236 are used respectively as multipliers for the Fast TL and Slow TL levels.
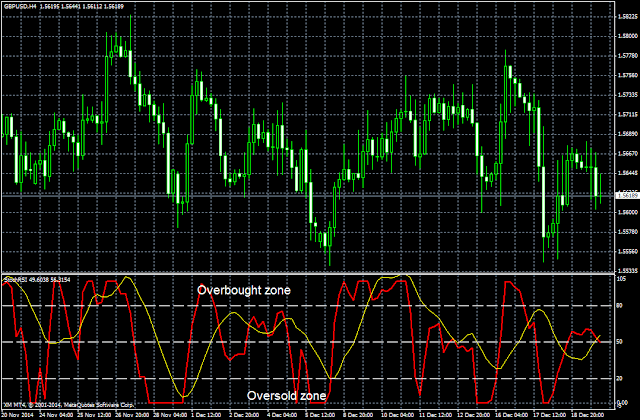
The visual aspect of the indicator is as follows:

In the previous price chart, you can see the three lines that make up the indicator: QQE (green), Fast TL (red) and Slow TL (blue).
How to trade with the QQE indicator?
The QQE can be used in various ways in our trading. Below are some of its most common uses:
Cross trading signals
We have three possibilities:
- Crossings of the QQE line with the Fast TL or the Slow TL: we will have a buy signal when the QQE crosses above the Fast TL or the Slow TL, while a sell signal will be generated when the QQE crosses below the Fast TL or Slow TL.
- Crossings of the QQE with the level 50: when the QQE crosses above 50, we will have a buy signal, while if it crosses below the level 50, we will have a sell signal.
- Crosses between Fast TL and Slow TL: A buy signal will be produced when the Fast TL crosses above the Slow TL, while a sell signal will be generated when the Fast TL crosses below the Slow TL.
Divergences between price and indicator
As with traditional oscillators, it is also possible to work with divergences between the QQE indicator and price to try to identify possible turning points in prices. Thus, if we detect a bullish divergence (presence of lower lows in the price and higher lows in the QQE) we will buy the asset, while if there is a bearish divergence (higher highs in the price and lower highs in the QQE), we must sell.
Overbought and Oversold Zones
In the same way that we work with the original RSI and other oscillators, the QQE indicator can also be used to identify potential overbought and oversold price conditions. The QQE indicator indicates an overbought condition when its value is equal to or greater than 70, while if its value is equal to or less than 30, we will say that the market is oversold. Additionally, the relative position of the Fast TL and Slow TL lines with respect to these levels can also be used to detect overbought and oversold situations.
From these levels, we can generate trading signals. Thus, when the QQE (or also the Fast TL or Slow TL) crosses above 30, a buy signal is given, while when the QQE (or any of its dynamic levels) crosses the 70 levels downwards, we will have a sell signal.
Conclusions
After doing some tests with the indicator, I have been able to observe that, in general terms, it is more efficient than the RSI, combining quite accurately the characteristics of trend indicators and overbought/oversold indicators in a single oscillator, although it still has the disadvantage of the usual delay in this type of smooth oscillators.
In any case, as usually happens with anything related to trading, there is nothing like trying it out and doing experiments to see if the QQE indicator fits within our trading arsenal and we can develop trading strategies from it.
For those who want to try, you can download this indicator for the Metatrader 4 platform through the following link:


