When you design a trading system, or you are looking to buy an automatic robot on the market, you must make decisions according to your preferences. The first thing you should ask yourself is: what am I looking for?
It is clear that you are looking to earn a lot of money, yes… this is what we all seek. But after a few losses and disappointments you learn that in Forex and other markets there are no magic methods and that the perfect trading system does not exist.
So, the right question is: how can you evaluate and compare different trading systems according to their risk level and potential benefit to know if they are viable for your use?
In this article we are going to review different statistical metrics to assess the performance of an investment system.
List of ratios to evaluate trading systems
There are several types of ratios to evaluate performance. Each ratio can inform us of something different: Profitability, risk, trading frequency, duration, reliability, win ration or any factor that can be measured.
The important thing is to know which are the best ratios and which statistics are meaningful to you.The trader must establish from what level he can feel comfortable trading a system and in this way apply a more adequate money management.
These are some of the ratios and statistics that I usually analyze when I evaluate the results of a trading system:
Net profit
This is very easy to understand. It is the profitability of the system, which can also be expressed as a percentage of the initial capital.
Ideally, logically, the higher the net profit a trading strategy is capable of generating, the better for the trader. However, we must analyze how this benefit is composed:
- Is it stable over time or do we have strongly negative periods?
- How many profitable trades does the trading system produce?
- Are there only a couple of trades with good profits and the rest just losses?
- How much loss does the system have to bear in order to generate this profit?
Compound annual return
CAR = 100% * ((final value/initial value)^(365/days traded with the strategy) – 1)
Exposure (Percentage of exposure)
It is the percentage of time that the trader is exposed in the market.
Exposure = (Number of bars where we are in the market/Total number of bars for the period) * 100
For example, a system where we always have an open position, buy & hold style, will have a 100% exposure. It is considered that the longer the system is in the market, the more risk this system will have.
Drawdown
The drawdown tells us how much money is being lost since the last high on the equity curve.
Maximum drawdown (MDD) is the largest distance between a peak and a trough on the equity curve. In other words, it is the distance between the highest high and the subsequent lowest low.

It is important to note that the maximum drawdown of a backtest does not represent the real risk of your system. If you want to better understand what Drawdown is and how to deal with Drawdown periods, I recommend that you read this post: What is Drawdown and how to interpret it correctly?
Recovery factor
It is the result of dividing the net profit by the maximum drawdown of the system.
It measures how quickly the system recovers from drawdowns. Obviously the higher this ratio, the better the system we are using.
Recovery factor = (Net profit/maximum drawdown)
You can also find it under the name “profit to drawdown”.
Profit factor
This is an important performance indicator of a trading system and one of its greatest advantages is the simplicity of its calculation.
The profit factor is the result of dividing what the winning trades earn by what the losing trades lose.
For it to be worth using a trading system, the profit factor must be greater than 1, if it is less it means that the system is not profitable.
Profit factor = ∑profits of profitable trades/∑losses from losing trades
You can find out more about the profit factor in this post: What is profit factor and how to use it?
Number of trades
How many trades were made in the analyzed period?
When comparing the performance of different trading systems it is also important to take into account the frequency with which the trades are performed. It may be the case that a system with a lower expectancy is more profitable than another with a higher expectancy because it has a large number of annual trades.
Win rate
The win rate indicates how many winning trades are there over the total number of trades performed.
This ratio indicates the reliability of the system but also allows us to see how comfortable the trader can feel when using it. Psychologically it is very difficult to trade with a system with a low percentage of winning trades, even when the profit per trade is very high.
Number of consecutive losses
It is good to know how many consecutive losses you can suffer. On the one hand, depending on the loss streak, this ratio can have a greater or lesser psychological impact on the trader, but on the other, knowing the number of consecutive losses that we can face helps us to better plan the money management of the trading system.
Mathematical expectancy
Having a positive mathematical expectancy is an indispensable condition that any minimally reliable system must meet.

To make money with a trading system, it is not necessary to win on all trades. It is the combination of the number of times we win or lose and how much we earn per trade that really counts.
Attention: You need a positive mathematical expectancy to be able to win in the long term with your trading system, that is always the base condition. However, when you reinvest your profits, the amount of the final profit will depend on the geometric mean.
You can find out more information about the mathematical expectancy in this post: How to calculate the mathematical expectation of a trading system?
Sharpe Ratio
The Sharpe ratio measures profitability over the dispersion of results.
It is calculated as the annualized return minus the risk-free return, and this result is divided by the standard deviation of the investment.

You can see more details of this indicator here: What is the Sharpe ratio?
K-Ratio
Like the Sharpe ratio, the K-ratio also seeks to evaluate profitability based on risk, but it does so from a different perspective because the K-ratio does take into account the order in which the results are produced.

The K ratio evaluates the performance of the trading strategy based on the stability of the equity curve. The K-ratio will be higher the higher the profitability of a system and the lower the deviation of the results.
In the K-ratio, performance is represented by the slope of the linear regression, and risk is symbolized by the standard error of the regression.
Sortino ratio
In a way the Sortino ratio is a modification of the Sharpe ratio.
As before, in the Sharpe ratio, risk is represented by volatility (standard deviation).
-Risk in Sharpe → when the results vary from each other, both upwards and downwards.
On the other hand, in the Sortino ratio the risk is only negative volatility (standard deviation of negative returns).
-Risk in Sortino → how much the results vary when they are lower than your target.
You can read more details about this ratio in the article: The Sortino Ratio – the good and the bad volatility in your investments
SQN – System Quality Number
The SQN (System Quality Number) is a performance measure developed by Van Tharp.
The SQN is based on the relationship between the mathematical expectancy (we have explained this concept a little above) and the standard deviation. All this measured in multiples of R.
What do these multiples of R mean? To give a rudimentary example of multiples of R: We open a position at $100, with a stop loss at $80 and close the trade at $150. The multiple of R in this case would be 2.5 (50/20).
SQN ratio formula = √number of trades * Expectancy measured in R ÷ Standard deviation of multiples of R
MAE – Maximum Adverse Excursion
The term MAE refers to the largest movement against you while you are in a trade.
MAE = (entry price – minimum during the trade)/ entry price
It looks much better with a price chart:

The MAE is used to measure the risk and capital necessary for trading.
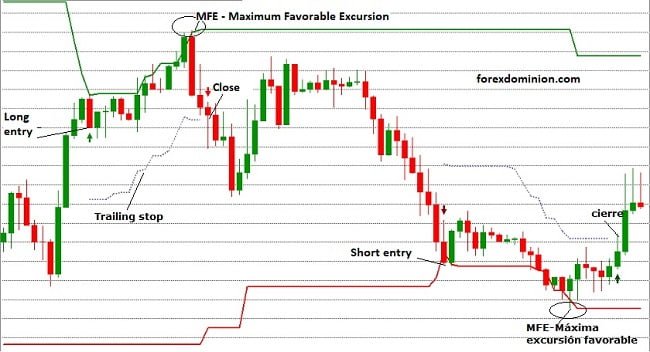
MFE – Maximum Favorable Excursion
The MFE, or maximum favorable excursion, is the biggest move in our favor while we are in a trade.
In this sense, it represents the other face of the MAE.
Equity curve of the trading system
In addition to examining the metrics and ratios, don’t forget to analyze the equity curve of the system.
By representing the results in a graph, it is much easier to see how your trades evolve over time and to have a better perspective.

At this point you have to start asking yourself: Does it matter to you to earn a large net profit with the danger of a significant drawdown? Do you prefer a high percentage of winning trades, even at the risk of reducing the profit per trade? Are you looking for big profits per trade with few trades per year?
I am Raúl Canessa, the founder of Forexdominion.com. As an experienced Forex trader, my passion for investing and algorithmic trading has shaped my professional journey. Over the years, I have dedicated myself to refining my skills in the financial markets, allowing me to share my knowledge and insights through my platform. I am committed to helping others understand the world of trading and develop effective strategies for success in this exciting field.


