To correctly analyze the performance of investments in the stock market and other financial markets, it is always advisable to relate profitability with respect to risk. One of the most used ratios for this is the Sharpe ratio. But today we will see that it is possible to further refine this measure using the Sortino ratio. Both ratios serve to measure the expected return of an investment fund, calculated on the expected return of an asset without risk, however, they present a series of subtle differences that we are going to show next.
What is the Sortino relation?
In a way, the Sortino ratio is a modification of the Sharpe ratio. So I think the best way to explain it is by comparing both ratios.
In both ratios, the excess of profitability (asset profitability minus the profitability of the target) is compared with respect to risk. But it is there, in the way in which risk is measured where the difference is.
In the Sharpe ratio the risk is the volatility of the returns (represented by the standard deviation).
→ Risk in Sharpe → when the results vary among themselves.
In contrast, in the Sortino ratio, the risk is only negative volatility (standard deviation of negative returns).
→ Risk in Sortino → how much the results vary when they are lower than your target.
Disadvantages of the Sharpe ratio
As we discussed our article on the Sharpe ratio, one of the drawbacks of this measure is that it likens the risk to the standard deviation, and does not distinguish between positive and negative deviations.
For this reason, the Sharpe Ratio will penalize, for example, a trading system that hits few trades and earns a lot each time. This may be the case of systems that follow trends, where the standard deviation of positive results is greater than negative ones. Resulting in a lower ratio although the strategy is better than another with less dispersed results.
Good and bad volatility
To illustrate the previous topic I propose an example.
You have two systems with the same average profitability and even the same deviation.
- System A: is a system that follows the typical advice of “let the profits run and cut the losses quickly”. Does it sound good, right?
- System B: is a system with a lot of winning trades (we like that), but when it has a losing trade you can loss approximately 3 times what you earn.
How do you think the ratios will evaluate these two systems?
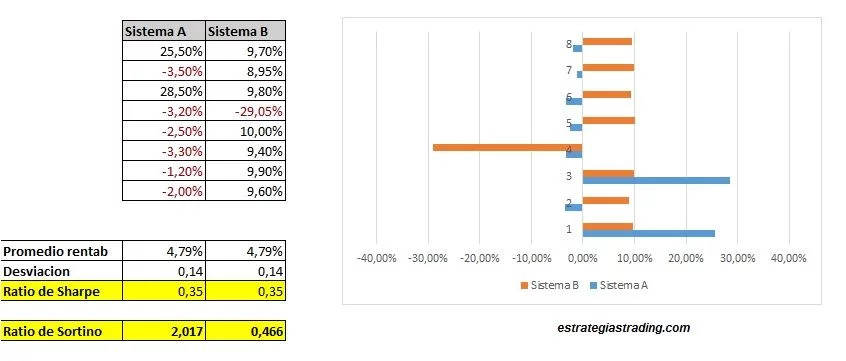
The profitability is the same. The standard deviation of the results is the same. Result: for the Sharpe ratio both systems score the same.
But look at the distribution chart of trades. Both charts look very different.
Here the Sortino ratio gives us more adequate information than Sharpe’s, giving a higher score to the system that has less risk.
How to calculate the Sortino ratio?
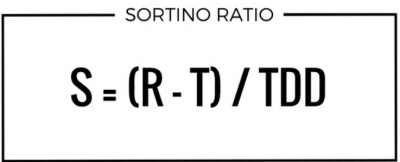
The formula of the Sortino Ratio is as follows:
S = (R -T) / TDD
Where:
R = average annual return
T = The minimum acceptable performance, target or performance objective. It can be zero, or any other benchmark such as the performance of a stock index.
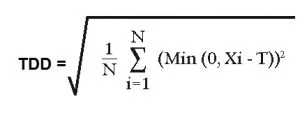
TDD = means target downside deviation. It represents the dispersion of the results that are inferior to the target.
This is his formula, but now we see it better with an example.
Calculation example in Excel
The following example I found on the CME Group website (link here).
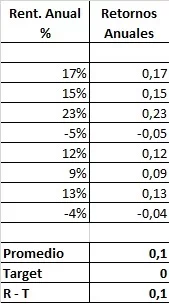
- We start from a series of supposed annual results: 17%, 15%, 23%, -5%, 12%, 9%, 13%, -4%. And we also assume that our target is 0. (You already know that you can use the target that you consider appropriate).
- We calculate which is the average profitability minus the target.
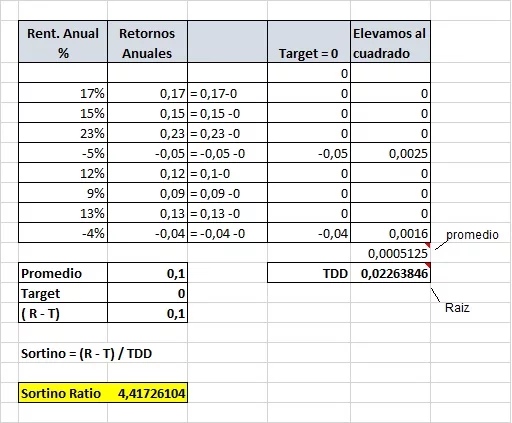
- We calculate the TDD: We calculate the difference between each result and the target. If the result is greater than the target we attribute 0%. Each result is squared.
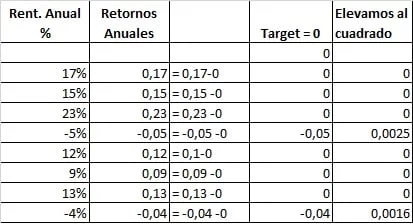
We calculate the average of all these squares (including the results equal to 0), and we do the square root of this mean. The result is the TDD.
- Finally the Sortino Ratio is S = (R -T) / TDD
I am Raúl Canessa, the founder of Forexdominion.com. As an experienced Forex trader, my passion for investing and algorithmic trading has shaped my professional journey. Over the years, I have dedicated myself to refining my skills in the financial markets, allowing me to share my knowledge and insights through my platform. I am committed to helping others understand the world of trading and develop effective strategies for success in this exciting field.


