Introduced by Van Tharp in 2008 in his book The Definitive Guide to Position Sizing, the System Quality Number, abbreviated as SQN, is an indicator designed to evaluate or measure the performance of a trading system or strategy. Subsequently, some variants and uses of the original formula have emerged that I consider very interesting; in particular to obtain sets of optimal parameters that simultaneously maximize the trade average size and the standard deviation of results in a sample space of N trades.
In particular, the SQN measures the relationship between the mathematical expectation and the standard deviation of a distribution of R-multiples generated by a trading system. In order to continue talking about the SQN, we must therefore define what is the R-multiple: it is the relationship between the profit obtained and the risk assumed per operation.
Thus, if in a trade we obtain a profit of $500 and we have risked $250 (the loss that we would have obtained, for example, if the stop loss had been triggered), our R-multiple would be 500/250 = 2.
Taking into account the above, the mathematical expression of the SQN is the following:
SQN =Square Root(N)*E/SD
Where:
N = Number of trades
E = Mathematical expectation of the system in terms of R
SD = Standard deviation of the multiples of R
For example, if we have a system that in 25 trades wins 30% of the time and has a R-multiple equal to 5 (that is, it wins 5 USD for each unit risked in a trade) with a standard deviation of 2.5, the SQN value will be:
SQN = Square Root (25)* [0.3×5 + 0.7x(-1)] / 2.5 = 5 * 0.8 / 2.5 = 1.6
The first thing that you must be very clear about is the concept of R. The R value is the difference between your entry price and the initial stop loss, that is, the initial risk. Then all gains and losses are expressed as multiples of R.
The expectation of the trading system can also be defined as the average of the R-multiples (negative and positive) of the trading system.
Note that this expression is clearly affected by the number of traders; If instead 25 trades we take 100, maintaining the rest of the parameters, we would have the value of the SQN as:
SQN = Square Root(100)* [0.3×5 + 0.7x(-1)] / 2.5 = 10 * 0.8 / 2.5 = 3.2
The other parameter that will significantly affect the value of SQN, assuming that we have a system with positive mathematical expectation, is the standard deviation of the multiples of R. The value of this parameter is closely related to the concept of Maximum Favorable Excursion and Maximum Adverse Excursion (MFE and MFA). Thus, if in the first example we had a deviation of 1.25 instead of 2.5 we would have an SQN equal to:
SQN = Square root(25)* [0.3×5 + 0.7x(-1)] / 1.25 = 5 * 0.8 / 1.25 = 3.2
A priori the idea is very good but we need some reference to be able to assess these figures and decide if a system is good or not. To do this, Van Tharp proposes the following scale:
- 1.6 – 1.9 Below average but can be operated
- 2.0 – 2.4 Average
- 2.5 – 2.9 Good
- 3.0 – 5.0 Excellent
- 5.1 – 6.9 Magnificent
- > 7.0 Holy Grail?
In view of the previous results, we can see that an increase in the number of trades or a decrease in the standard deviation of the R-multiples can make a system go from being mediocre to excellent in terms of the metric proposed by Van Tharp. In other words, optimizing a system based on the SQN will allow us to develop more robust systems, since we will be taking into account several factors that affect the performance of the systems simultaneously.
Furthermore, if we calculate the SQN for several systems we can compare them with each other and select the one that obtains a higher score.
In addition to the benefits that we have already seen for the SQN, we have that, apart from evaluating trading systems, it also has a somewhat lesser-known use: using it as a measure of trend intensity. In particular, since we cannot define multiples of R in this case, the SQN formula is directly applied to the daily percentage returns of a certain index or a stock, calculating its average and its standard deviation and multiplying by the root of the number of selected periods. The usual thing is to calculate this metric for 25, 50, 100 and 200 periods (in fact, this is what Van Tharp does in his paid newsletter) and compare it with a table like this one (the values are approximate, they may vary for some markets):
- >1.47 Very bullish
- 0.7 – 1.47 Bullish
- 0 – 0.7 Neutral
- -0.7 – 0 Bearish
- <-0.7 Very bearish
How to increase the SQN in the best possible way?
It is obvious that we have three possible alternatives:
1) Improve the average profit. For this there is only one way: Apply the motto “low amount but high-quality trades. How? Filtering the entries in such a way that we obtain a Pareto-optimal solution in the entire sample space. If we can improve the 80:20 ratio, by reducing the number of trades in exchange for a larger average size, we will have killed two birds with one stone: We will spend less on commissions and the relative impact of the slippage will be less.
In other words, we should focus on the best quality signals of the trading system, the ones that have the highest probability of generating successful trades and produce the highest number of pips.
With this, we increase the average profit per trade and the R-multiple and reduce its standard deviation.
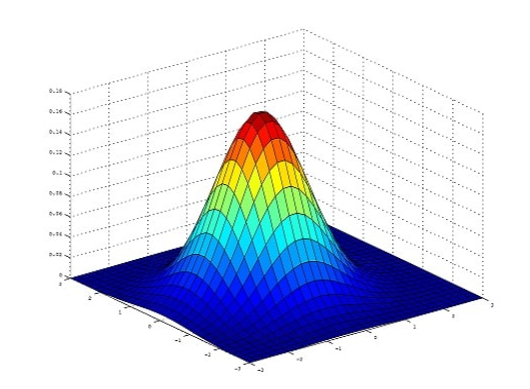
2) Obtain a distribution of results as narrow as possible. Here we are in an inverse situation. Perhaps, the easiest solution will be to adjust the stop losses and profit targets, in such a way that, in the histogram, the results are grouped as much as possible around the average. The goal will be to trim the tails of the distribution. But of course, this is not always possible -or desirable-, among other things because, in accordance with Pareto, we will end up depriving the system of the best trades.
3) Execute more and more trades to get as large a number “N” as possible. With this, three things are basically obtained: (a) Robustness: The statistics of a system are only reliable when they are backed by a long series of trades. (b) Smoothness: A smoother and more continuous profit curve profile. (c) Better knowledge of the behavior of the strategy in different time frames. Therefore, it is logical that a quality estimator, such as the SQN used to compare systems, would positively weight those with a longer history.
Conclusion
This indicator developed by Van Tharp allows us to objectively evaluate the performance of our trading systems. With the SQN ratio you can also optimize the parameters of your system to make it more robust.


