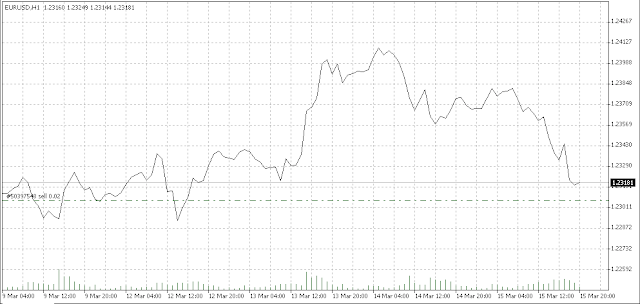

In technical analysis the technical traders use various types of price charts. The simplest of these types of charts is the line chart which is used to obtain an overview of price movements in the market. In this case it shows the closing prices at selected intervals. Line charts are very clear and facilitate the detection of the most obvious chart patterns but lack the detail level offered by bar charts and Japanese candlestick charts.
In these price charts the points for price are joined by lines. In general the price used is the closing price of the period (which may be 5 minutes, 1 hour, etc..), but it can also display the average price, the buy/sale price, and many other options that vary according the trading platform that we use.
