- EUR/USD stops at the 1.1000 zone and turns lower.
- Investor sentiment could determine the pair’s short-term trend in the coming sessions.
- In this article we present the most important technical levels to consider.
The EUR/USD currency pair deepens bearish movements and accumulates two consecutive days of losses since last week after the price was rejected by technical resistance at 1.1000 on Thursday.
In this context, the exchange rate of the pair falls 0.5% and falls below the psychological level of 1.0900, in parallel with the return of risk aversion in the financial markets due to the new tensions between Washington and Beijing.
The new national security law in Hong Kong proposed by the Xi Jinping government in response to the 2019 pro-democracy protests has opened a new front of disputes between the United States and China, which could jeopardize the trade agreement signed by both nations last year.
The renewed geopolitical nervousness appears to have overshadowed the news about the €500 billion recovery fund raised by Germany and France a few days ago to rebuild the eurozone economy after the coronavirus pandemic wreaked havoc and, in many cases, irreversible damage.
In the short term, the EU currency will remain sensitive and vulnerable to changes in investor sentiment caused by the skirmishes between the United States and China, so further declines should not be ruled out as investors adopt a more defensive profile.
EUR/USD Technical Analysis
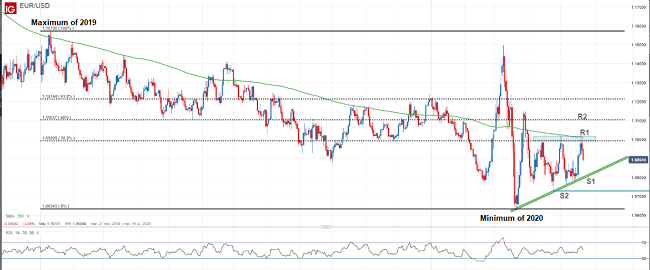
Sellers regained control of the market after the EUR/USD reached a resistance confluence zone around 1.1000, defined by the May highs and the Fibonacci retracement of 38.2% from the high of 2019 to the 2020 low. If the declines deepen in the coming sessions, it is important to keep a close watch on support at 1.0800 (short-term uptrend line), as its breach would bring into play the April low of 1.0727.
EUR/USD Technical Analysis
Sellers regained control of the market after the EUR / USD reached a resistance confluence zone around 1.1000, defined by the May highs and the Fibonacci retracement of 38.2% from the 2019 high drop to 2020 low. If the declines deepen in the coming sessions, it is important to keep a close watch on support at 1.0800 (short-term uptrend line), as its breach would bring into play the April low of 1.0727.
In case the market starts to rise, the most relevant resistance lies at 1.1000. A breakout from this technical ceiling would facilitate the recovery up to 1.1105 (Fibonacci retracement of 50%).

S&P 500 consolidation phase continues, bulls and bears fight for market control
The S&P 500 closed the previous week with slight falls and fell 0.2% to 2944, in a context of greater caution due to geopolitical tensions between China and the United States, after the Xi Jinping government proposed to implement a new security law in Hong Kong in response to the 2019 protests.
New disputes between the world’s two largest powers have created speculation that the trade agreement signed in 2019 could collapse, just as the world economy is at its worst due to the state of paralysis caused by the COVID-19 pandemic. This situation, coupled with the health crisis, generates uncertainty and reduces appetite for risky assets such as stocks on the stock exchange, thus limiting the recovery of the world’s main stock indexes.
From a technical standpoint, the S&P 500 has been stuck in a consolidation side channel in the 2750-2975 range since mid-April. The index price has repeatedly tested the upper and lower limits of the channel, but it has not been able to decisively break them, a sign of indecision on the part of investors.
Until there is a definitive breakout in this channel, we will not see strong movements and the market bias will be neutral. On the other hand, if buyers or sellers cause a channel breakout, we could expect more marked directional movements.
In this regard, a breakout of resistance in the 2975s could trigger an upward move to resistance in the 3140s (R2), a strong resistance formed by the March high. In the event that the price is rejected by the barrier in 2975 and resumes falls, the first support under consideration is located at the lower limit of the channel in 2750. If sellers manage to violate this technical floor, the next objective is located around 2640 points.


