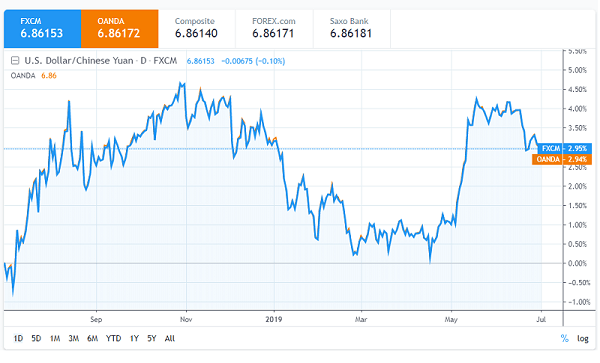
Week marked by trade negotiations between the US and China

Stock markets are trading aimlessly on Monday after macro data showed that the US unemployment rate fell to its lowest level in almost 50 years, easing fears of a slowdown in the world’s largest economy.

Wall Street optimistically celebrated the latest monthly employment report in the US, after learning that 136,000 jobs had been created in September, and that the unemployment rate fell to 3.5%, its lowest level since December 1969.

The employment report last Friday was strong enough to mitigate fears of a recession, but kept alive the hope that the Federal Reserve will remain firm in its stance to cut interest rates at the end of the month.

Read more

Global stock exchanges continue their bull market

Stock markets rose during the past week after China’s Ministry of Commerce announced last Thursday on its website that the United States and China will resume talks early next month in Washington. The commercial representatives of the two countries will hold preliminary talks in mid-September to prepare high-level negotiations in October.

The announcement came after a call between China’s vice prime minister, Liu He, the US trade representative, Robert Lighthizer, and US Treasury Secretary Steven Mnuchin. As reported by the Ministry of Commerce, the governor of China’s central bank, Yi Gang, also participated in the telephone conversation.

Read more

Stock markets rise after the G20 summit

The week begins with significant rises in stock markets and retracements in bond yields, after the United States and China agreed to resume trade negotiations.

Both countries agreed on Saturday to resume trade negotiations, President Donald Trump offered some concessions to his Chinese counterpart, Xi Jinping, at the meeting held in the framework of the G20 summit in Japan. The US president promised not to make new tariff increases and will allow US companies to sell their products to the Chinese manufacturer Huawei.

On the other hand, the data published last Friday showed that the consumer price index in the United States fell to 1.5% in May. This is a key indicator for the monetary policy of the Federal Reserve and led investors to bet on an aggressive policy of monetary easing by the Fed.

Read more

The Fed pushes the stocks and presses the bonds and the dollar

Equity markets continued to rise the previous week, while the dollar and global bond yields contracted, after the Federal Reserve signaled possible cuts in interest rates for this year. The yield on 10-year US Treasury bonds fell to 1.974%, its lowest level since November 2016.

Signs that China and the United States will resume trade negotiations after a six-week hiatus also reinforced investor sentiment.

The Federal Reserve chairman, Jerome Powell, said after the monetary policy meeting that the “justification for a more accommodative monetary policy has been strengthened” but the Fed wants to “see more data” before making decisions.

Read more

EUR/USD Analysis: Recovery seems to be corrective at the moment

  • The EUR/USD is recovering after testing the 1.1200 level, but the bullish outlook is still unclear.
  • The disappointing data from the United States caused the dollar bulls to be in suspense for the time being.

The EUR/USD has been moving around 1.1200 since the beginning of the day, bouncing from the area in a modest way, since the psychological barrier is a level difficult to break.  However, the US currency maintains its strength, since the latest macroeconomic publications in the United States make investors doubt a turn in the monetary policy of the Federal Reserve, given that consumption continues to be resilient. The central bank of the United States is scheduled to meet this week, and its decision will be key to the dollar. Meanwhile, Benoit Coeure of the ECB warned of “gloomy” indicators on the health of the global economy, and that the risks could materialize in the next meetings.

Read more

Dollar shows weakness between trade tensions and key economic data

The trade war between the United States and China continues to be the focus of the markets. However, in the last hours a new conflict was added, of similar characteristics, but with different causes, such as the announcement that the United States will impose, from June 10, tariffs on imports from Mexico for 5% .

In this way, not only does a new dispute begin with unpredictable derivations, but the implementation of the new trade agreement between these two countries and Canada, which the United States unilaterally called USMCA, is questioned. In addition, it generates a major concern in the US business sector, given that there are many firms that have their factories in Mexican territory, and export to the United States.

Read more

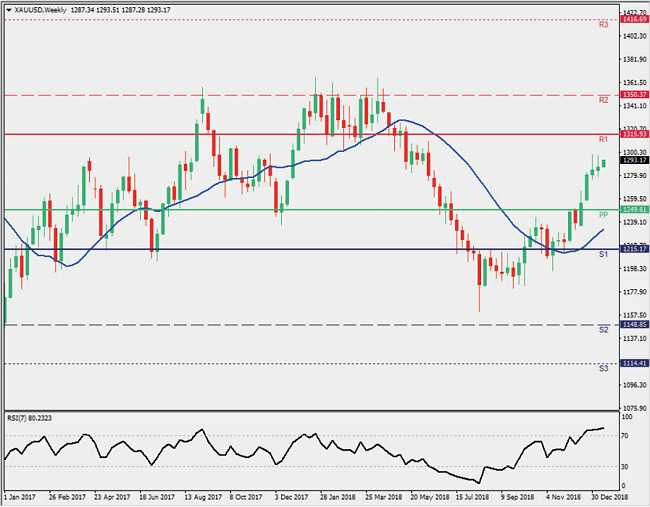
Gold Markets Trend For 2019

2018 was full of disappointment for commodities, contrary to expectations. Markets started the year with very high hopes, after upwardly revised growth projections in late 2017. As January and February are traditionally strong months for Gold, the strong demand noticed in the first quarter of 2017 helped the asset start 2018 in bullish mode.

In contrast to the forecasts, however, Gold markets bottomed out by the end of August at $1160 as it faced Dollar strength, mainly due to the Fed interest rate hikes. By the close of 2018 things changed as commodities perked higher, with Gold reversing more than 61.8% of the year’s losses.

Projections for 2019 point towards a bullish outlook for Gold on the perspective of a weaker year for the US Dollar. The slowdown in the global economy and the fact that policymakers are trying to focus on maintaining robust domestic growth momentum, as well as trade tensions and political jitters, leave the balance of risks to the downside.

Read more

How have the main currencies behaved during 2018?

The year 2018 has been marked by tensions and uncertainty. The commercial war between the United States and China has been carried to its maximum level, the rise of interest rates and QT (quantitative tapering) has continued in the US and in Europe the QE (quantitative easing) has been ended. Towards the end of the year the atmosphere is even more tense with the “gilets jaunes” (yellow vests) in France, the political escalation between the US and China and the fall of the world stock markets. On the other hand, the price of oil is practically at a minimum, although it seems to start to rise, which has helped to reduce the increase in global political-economic tensions.

On the one hand, the low price of oil contains inflation, which reduces the pressure towards the contraction of the monetary stimuli of the main world banks and on the other hand supposes an injection of disposable income for consumers.

Read more

Support and Resistance in Trading

Two of the most basic concepts in the technical analysis of the financial markets are both the resistances and the supports. And when we talk about basic concepts we mean that they are very simple to understand and at the same time they are one of the pillars on which the technical analysis is based. First of all, we are going to define what is support and what is resistance.

  • Resistance is defined as a level or price above the current price at which the selling force will stop and eventually exceed the buying force so that it puts an end to the bullish momentum. This causes the price to begin to fall and even to reverse the upward trend. In a price chart like the one shown in the following figure, the resistances can be identified as previous peaks reached by the price before falling. In an upward trend, the resistances can be visualized as increasing highs.
  • The concept of support, on the other hand, is opposite to that of resistance. Support is defined as a level or price below the current price in which the buying power equals and eventually exceeds the selling power so that the bearish momentum is stopped and this will cause the price to rise and even the bearish trend could be reversed. Generally, in a price chart, the supports can be identified as minimums reached before the price starts to rise. In a bearish trend, the supports can be identified as increasingly lower minimums.
The following image shows several real examples of resistance (lines R1, R2, R3, R4, and R5) and supports (lines S1, S2, S3, S4, and S5).

Read more