Triple Bottom Reversal Pattern

Description of triple bottom pattern

Many successful investors keep implementing well known chart patterns such as the “Triple Bottom” in their trading strategies model. Forex traders are not the exception as many traders around the world use formations as the triple bottom to take decisions regarding their trades in the market, including the opening and closing of market positions. The triple bottom chart pattern combined with other market analisys tools allows to discover important trading opportunites to speculate in financial markets like Forex.

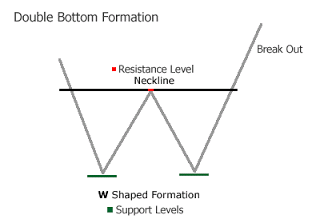
Triple bottom chart pattern is also described as TB in short, which is a kind of technical chart analysis examined in the market bottoms. Being the most reliable and trustworthy form of chart pattern, the triple bottom remains outright in its character and it is described by 3 distinct lows within the market having the similar price standards. The triple bottom remains distinct to the head and shoulders chart pattern and the only difference is the 3 lows occurring in the bottom throughout the similar price level existing in the double bottom.

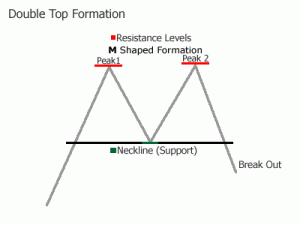
This formation is the opposite of the Triple Top Pattern.

Read more

Triple Top – Reversal Chart Pattern

Triple Top Pattern Explained

Triple top pattern, shortly called as TT is a technical analysis chart pattern which is determined at the market tops and can be seen in every financial market, including Forex and the stock market for example. Among the many different chart patterns, the Triple Top (TT) is the best and authentic chart patterns examined in the trade analysis chart. The TT pattern remains distinct from the head and shoulders pattern, apart from those 3 peaks remaining top with the similar price level that works like the double top.
The 1st peak occurring in the triple top patter is made while the rates drop down in the consolidation of the clear market phase. Rates will further accelerate up to a standard of the 1st peak where buyers will stop gaining maximum benefit for pushing the rates by means of resistance. Also the 3rd peak is made in a similar way. This formation is the opposite of the triple bottom pattern.

Main features of the Triple Top

As discussed above, triple top will look like 3 sharp peaks with similar levels in at all the point. Generally, TT arises while the market is on its peak time with an uptrend. The 3 peaks should remain sharp and definite, while the low could look like a rounded valley. This chart pattern remains comprehensive while the rates drop below the least low in the structure pattern. Bulkowski state that, the TT pattern is formulated with multiple variations and suggest the traders to set a well-defined congestion pattern.

Read more

Double Bottom Pattern – Definition & Description

 
If you are a pro Forex trader, you would certainly know a lot of information on the double bottom chart pattern. In this case, Double Bottom is a high potential chart pattern which is significantly taught in Forex training. Moreover this is one of the best and successful patterns that are being followed by many successful Forex traders. This chart pattern looks very similar like the alphabet ‘W’. Expert Forex traders most usually expect the price to be in down trend making a BOTTOM. It will slightly rally up while it is sold down with the previous bottom. We can say that this figure is the opposite of the Double Top pattern.
Forex traders generally look around for a fair increase when the market hit the resistance. For giving you a better idea in this regards, here is an example for reference: Just consider when the market drops down from $10 to the least of $2 during the 1st bottom, here the $2 buyers explore the market and drive-up the price at least for $5, where the sellers disdain the $5 level and trade the market again to $2. At this point, the price of the 2nd bottom remaining with $2, the buyers find it easier to get at $2 and further escalate the market again to $5. During this point after minor conviction, they will be able to push the market to $5 again.
Generally, the double bottom pattern appears while the price falls down and further bounces up and then falls down for the 2nd time in order to equalize the 1st drop. This is why experts compare this chart with the alphabet W. In most of the cases, the 2nd bounce in the price will usually be lesser compared to the first one. The 2nd chance of buying will get its peak which will be lesser than the 1st one. If the 2nd peak reaches, buying gets its end and now selling starts. This entails the 2nd leg of M pattern.

Read more

Double Top Chart Pattern

The identification of good and valuable chart patterns will help a trader to make great profits within any financial market including Forex. When it comes to chart patterns, you could find plenty of patterns being discussed and even e-Books describing the successful strategy. Well, not all of them work in reality. Here, you can find a lot of information on the double top reversal pattern that helps you to master your trading business and deserve a lucrative cash flow in the Forex market.

Doble Top Description

The Double Top is a chart pattern of high reliability which is formed in bullish markets and precedes a change in trend from bullish to bearish. Generally, double top will begin with a rise in price and it will gradually exhibit a drop. It will further increase in price within the similar level of the original rise, and make a drop further.

Read more

What is price action?

Price action is a common term used in trading to refer to the analysis of the movements made by the price of a particular asset or financial instrument in the market.
Although it is included in the technical analysis, the analysis of price action does not use any technical indicator and the forecast of the future price trend is made based on the interpretation given by the trader of the price movement and not by the value shown by an indicator.
Price movements as a time function can be represented in the form of price charts, tables or other graphics. When price charts used other related tool analysis of chart patterns, often included in the analysis of price action, although not all traders agree this classification.

Read more

Definition of Gap and Trap

What is a Gap and Trap?

A “Gap and Trap” is a price formation that can be observed in a individual stock, a market index, a currency pair, futures contract or other instrument or asset traded in financial markets.

The “Gap and Trap” occurs when there is an upward gap between one trading session and another, and investors begin to buy in the first minutes of the new session, when the price suddenly changes direction and begins to fall, trapping traders who bought shortly after the opening. Hence comes the name of the event, as “Gap” is the space between the closing price of the previous session and the opening price of the current session and “Trap” is referring to traders (buyers) who get caught in the market.

Read more