Should we trade in the Forex Market during the opening of the main exchanges?


A question that has many traders specialized in the Forex market is whether to open a position when any of the major exchanges like the New York Stock Exchange opens its daily session.

The fact is that during these periods is when the trader can get the biggest gains since these are the moments when the main future and stock exchanges open, there is a greater market participation of companies, institutions, funds and traders, and therefore there will be a higher volume of transaction in the markets including Forex.

Read more

Pure Trading System

This trading system seems to be relatively profitable because it quickly stops the losing trades and let the winners trades run, ie the ideal of all profitable trading systems. As with any strategy is very important to have discipline and follow the rules to the letter, not “hunches” or anything similar.
The first thing we will do is set the graphic settings as follows:
By using a SMA 50 in the High and a SMA 50 in the Low we form a channel which use is described below:

Read more

Alpari Trading Contests – Demo and Real Tournaments

The Forex broker Alpari, one of the largest companies and consolidated in the sector, regularly organizes trading competitions with cash prizes in which anyone interested can participate and trade in the Forex and other financial markets in general.

In total there are 5 contests, of which 2 are completely free and participants do not have to operate with their own money but with virtual money. Still, in these cases the prizes if they consist of real money.

More information about the broker Alpari and its Forex brokerage service in this complete review of this company: Analysis of Alpari Forex broker

A brief description of the five competitions:

Read more

Commodity Channel Index (CCI) Indicator

Commodity Channel Index – A Effective Tool for Traders

The Commodity Channel Index (CCI) was published in the October 1980 by Donald Lambert. Since its introduction its popularity is rising higher and higher as it is becoming a very common tool for traders. Commodity channel index is becoming a very effective tool for traders that use to identify cyclical trends in commodities as well as equities and currencies. There is nothing handier tool than the commodity channel index as it is a very easy way to chart cyclical turns in commodity prices. There are so many traders implied this tool in their business and get huge success in the field of trading. There is certain formula available to calculate commodity channel index.

The formula has been given below:

CCI =(Typical Price – SMATP) /(.015 X Mean Deviation)

Fortunately, you don’t have to calculate the CCI formula by hand, unless you have to give a good test of your mathematical skills or knowledge. CCI is an oscillating indicator and momentum indicator. The CCI is been calculated by using the typical price and simple moving average. The standard deviation is after that added with the scaling factor of .015 and scaling factor approximately confines 70% – 80% of indicators fluctuations around +100 to -100. Scaling factor of 0.15 was been suggested by Lambert Donald.

The formula makes use of simple moving averages of typical price that is same to the average price. The unweighted variables make the consistent evaluation of the actual conditions with relation to the historical price activity. CCI is been used to trade currencies, equities, as well as commodities. All the chartable assets are analyzed with the indicator. The CCI oscillates above & below zero line.

Read more

Relative Strength Index (RSI) Indicator

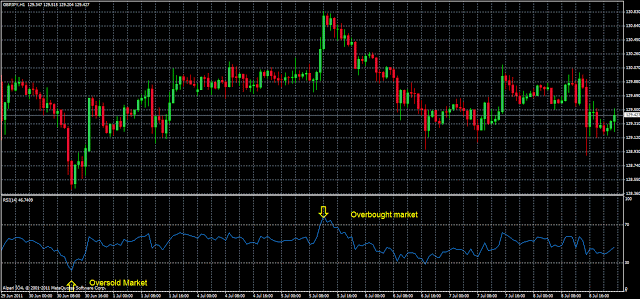
The Relative Strength Index (RSI) oscillator is a technical analysis tool that is used to measure the strength and momentum of a financial asset, such as a stock or a currency pair. It was developed by J. Welles Wilder Jr. in 1978 and is widely used by traders and investors. It is one of the most popular and helpful oscillators used in technical analysis. Their values ​​are obtained by comparing the gains against the losses of previous sessions (14 is the period recommended by Wilder).

The RSI oscillator ranges from 0 to 100, with readings above 70 indicating an overbought condition and readings below 30 indicating an oversold condition. Traders and investors use these levels to identify potential buying or selling opportunities.

The RSI oscillator is often used in conjunction with other technical analysis tools, such as moving averages and trend lines, to help confirm signals and identify potential trading opportunities.

History of the RSI oscillator

The Relative Strength Index (RSI) was developed by J. Welles Wilder Jr. and first introduced in his book “New Concepts in Technical Trading Systems” in 1978. Wilder was a mechanical engineer and trader who became interested in the stock market and technical analysis in the 1950s. He went on to develop a number of technical indicators, including the Average True Range (ATR) and the Parabolic SAR.

The original RSI formula used a 14-day period to calculate the average gains and losses. Wilder recommended using the RSI in conjunction with other technical analysis tools, such as trend lines and moving averages, to confirm signals and identify potential trading opportunities.

Since its introduction, the RSI has become one of the most widely used and popular technical indicators. It has been incorporated into many trading platforms and is used by traders and investors around the world to help identify potential buy and sell signals. Despite its popularity, the RSI, like all technical indicators, is not infallible and should be used in conjunction with other tools and analysis to make informed trading decisions.

Read more

Binary Options Trading Platform of Alpari

Alpari - binary options trading

Update: Contracts with binary options in Alpari are now known as Fix-Contracts, which have the same characteristics as binary options, but with another name. The possible reason for this change in the denomination is the bad reputation that these derivatives have acquired in recent years. Despite this, the information given below applies to the Fix-Contracts that this broker now offers.

Read more

Simple Forex Daytrading System

The following is a simple trading system that uses only two indicators and has given good results. It can be used in any market, including Forex, precious metals and others. Of course, we recommend that before using this trading system to trade with real money, it must be evaluated on a demo account. You can check our list of Forex brokers to find one that satisfies your trading needs.
This trading strategy uses the following indicators:
  • Bar/candles daily chart.
  • SMA (Simple Moving Average) of 13 periods.
  • 10-period RSI (Relative Strength Index), with a line at level 50.

    Read more

Trading System with RSI and CCI

This is a simple trading technique based on the use of the indicators RSI (oscillator) and CCI (trend indicator). The author claims it is a pretty efficient system, however, I recommend to evaluate it on a demo account before risking real money. The strategy was explained in a forum on the Forex market and its author has indicated that sometimes he obtains more than 400 pips in two days with this system.

To implement the system the trader requires a candle or bar chart with a time frame of 5 minutes (the trader can use longer time frames but can be more risky). The indicators used are the RSI at 14 (it can also be used with 8 periods too) with additional levels at 45 and 50 and the CCI with 14 periods. The recommended currency pairs are:

  • EUR/USD.
  • USD/CHF.
  • EUR/JPY.
  • GBP/USD.

Because it works based on oscillators and in a short time frame, the system produces false signals, which can be filtered using an indicator like the ADX at 14 for example. The MACD can also be used with a configuration of (3, 81, 29) and (3, 10, 16). Another indicator that can be used is a moving average to verify the direction of the trend. Remember that in markets with a strong tendency the oscillators produce even more false signals so it is best to trade in favor of the trend. For that an EMA can help us.

Read more

How affects the control of inflation the Forex market?

The increase in prices over time, which is inflation, in an economy experiencing growth is inevitable. Furthermore, it is accepted by most economists that a moderate rate of inflation is positive for the economy. In this regard, central banks try to control inflation to be kept within certain limits in order to exploit the positive effects of inflation and reduce the impact of negative effects. In this sense, monetary authorities maintain a constant struggle to control inflation and other monetary forces affecting the economy.

Increases in interest rates

Increasing interest rates is one of the main measures taken by central banks to reduce inflationary pressure when this is high. Moreover, it is easy to apply strategy whose effects are usually seen reflected faster in the economy in comparison with the effects of other methods. By raising interest rates, the central bank raise the benchmark interest rate at which commercial banks will look when granting loans to their clients.

Read more