The Bollinger Bands is a technical analysis tool developed by John Bollinger in the early 1980s.
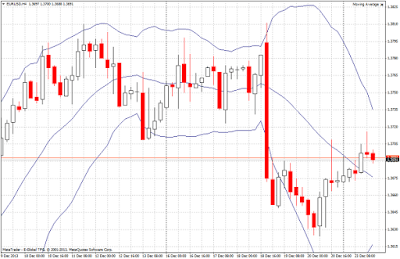
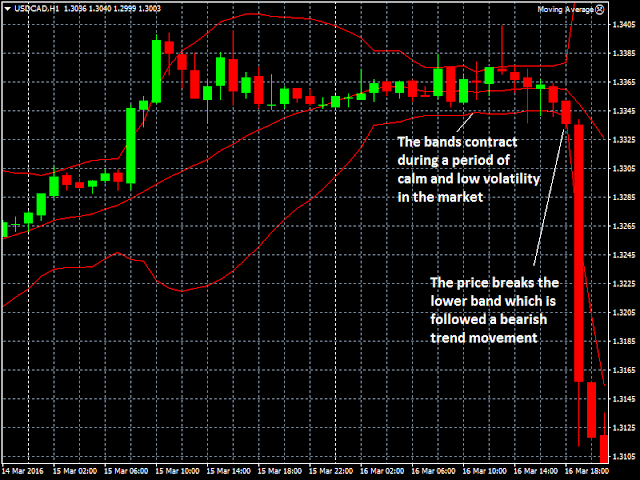
Bollinger bands consist of three curves drawn in relation to the price. These three curves are the upper band, the lower band and the middle band. The middle band is, as a rule, a simple moving average and therefore provides information on the trend. From the midband the upper and lower bands will be calculated using a standard deviation. The interval between the upper and lower bands gives information on the volatility or market activity. By default, the parameters used are a simple moving average of 20 periods and 2 standard deviations to calculate the upper and lower bands.
(Note: on some platforms and graphical analysis software the midband is not shown).