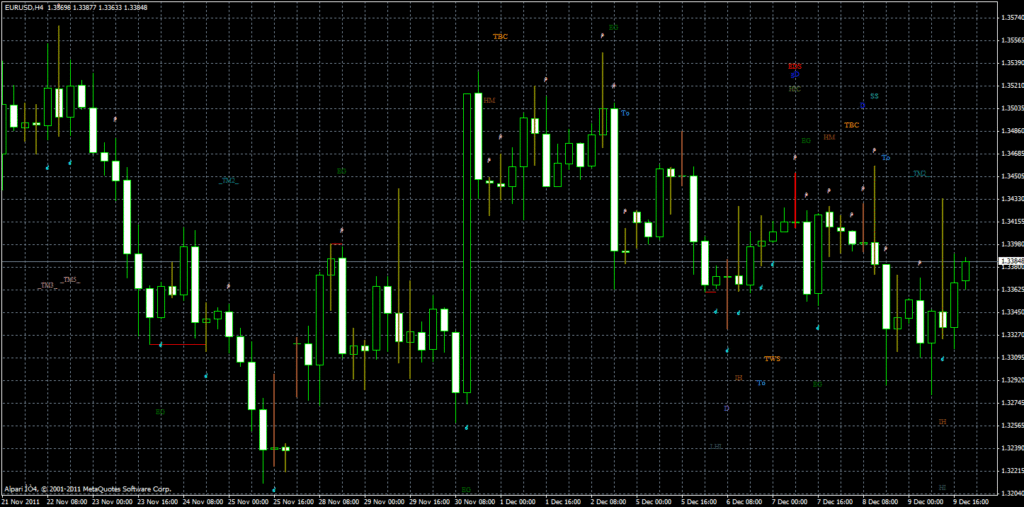
Double RSI Trading System for Forex

The trading system that we are going to present below is based on the use of two RSIs, as the name implies, specifically the crossings of two RSIs with different periods (One with a short period and the other with a longer period). As a filter of the signals generated by the crossings, the Fisher indicator is used, which allows having more reliable trading signals, since RSI crossings under certain market conditions can generate false signals and losses that could be avoided with the right filter.

The system itself is not complex. Long positions are opened at the RSI bullish crosses and short positions at the RSI bearish crosses. The Fisher indicator is used as a tool to confirm the different signals.

As always, it is recommended to test the system in a demo account before using it to trade with real money.

Read more

NR4/IB strategy for intraday trading

The NR4/IB trading strategy is an intraday trading system which was developed by the traders Lawrence A. Connors and Linda Bradford Raschke and presented in their book “Street Smarts“. The meaning of the letters NR4/IB is “Narrow Range Bar 4Bar/Inside” and each time this pattern is detected there is a high probability that the market will produce a strong movement after the breakup of the formation. This pattern consists of a series of four bars or candles in which the fourth candle has two very important conditions:

  • Condition 1: The last bar or candle (also called NR4) must have a minimum and a maximum lower than those of the three previous bars, which means that it is a narrow bar as it is trapped within the range of the previous bars.
  • Condition 2: The NR4 bar must not exceed the maximum or minimum of the bar that precedes it, which makes it what is known as the “inside bar”.

Read more

Weekly bearish market opening due to increased risk aversion

Investor sentiment remains fragile due to riots in Hong Kong, tensions in the Middle East and concerns over trade negotiations between the United States and China.

The US trade representative, Robert Lighthizer, said over the weekend that the two days of talks with China were productive, while the Chinese Ministry of Commerce described the talks as constructive and noted that they had made concrete agreements to move forward in the October high-level talks.

The United States eliminated tariffs on more than 400 Chinese products in response to requests made by several US companies. But investor sentiment was affected upon learning that Chinese officials unexpectedly canceled their visit to US farms scheduled for this week.

Read more

RoboForex RAMM Investment Accounts

What are RAMM accounts? The RoboForex RAMM (Risk Allocation Management Model) account system is a type of Forex trading account management service that is becoming a rapidly growing form of investment in the foreign exchange market and is based on efficient risk management and the proportional allocation of benefits. It is based on the concept of PAMM-managed accounts, offering the … Read more

Candlestick Patterns Indicator for Metatrader 4

This is an indicator for candlestick charts designed for Metatrader 4 which is based on the recognition of various types of patterns commonly used by many traders to open and close positions in the market. As you know, the Japanese candles usually form easily recognizable chart patterns which are indicative of possible future price behavior in the form of drops, rises, a continuation of the current trend, and trend changes. Logically, these patterns do not have a 100% percent reliable, but in some cases, this is quite high.

Logically, these patterns are not 100% reliable so sometimes produce false signals but are usually quite accurate. The problem is that it takes hours of practice and dedication to analyze price charts to detect these patterns, therefore only the most experienced traders effectively dominate its use to open and close positions in the market. That’s where this indicator is useful because it identifies 10 major candlestick patterns both in bullish and bearish trends and other minor patterns that often occur with some regularity. The result is that the trader can take advantage of any interesting opportunity such as a possible trend change indicated by one of these chart patterns.

Read more

Keltner Channel Indicator for Metatrader

Indicator Parameters MA_Period (normal value = 10): It is the moving average period corresponding to the midline. Mode_MA (normal value = MODE_SMA): This mode is the moving average corresponding to the midline. Price_Type (normal value = PRICE_TYPICAL): The type of price used in calculating the moving average corresponding to the midline.     The custom indicator Keltner Channel for Metatrader … Read more

Investors pending on geopolitical tensions and turbulence in oil markets

The weekly opening is being conditioned by this weekend’s attacks with drones against oil production facilities in Saudi Arabia and the disappointing economic data from China, two factors that triggered risk aversion.

Texas WTI oil prices rose 16% at the weekly opening, after it was known that attacks on Saudi facilities will reduce production by 50%, which is 5% of world production. It is the biggest interruption in the supply of crude oil in history, which also caused a historic rise in oil prices.

The president of the United States, Donald Trump, authorized the use of the country’s emergency reserves to guarantee the oil supply and also he said the country will respond to the attacks he attributes to Iran. For its part, Saudi Arabia has said that it is prepared to restore half of the production this Monday.

Read more

Keltner channels – How can we use them?

Keltner channels are a technical indicator consisting of three lines: a central line that corresponds to an exponential moving average, and two lines, upper and lower, calculated as a deviation from the central line based on the ATR (Average True Range). If you know the Bollinger Bands you will see that both are similar indicators, with the difference that the bollinger bands use a simple moving average (SMA) as the center line and the bands are calculated as standard deviation of this SMA. In addition, the introduction of the ATR for the bands calculation in Keltner channels gives it the feature of being an indicator based on volatility, as well as being a softer indicator than Bollinger Bands.

Keltner channels, based on an exponential moving average, are a trend indicator, a trend dictated by the inclination of the channel. The most prominent use of Keltner channels as a trend indicator is the identification of trend changes when channel breakouts occur as well as the identification of range phases in the market (flat trend). The areas determined by the upper and lower lines can be used to identify overbought and oversold areas.

The development of Keltner channels is attributed to Chester Keltner who introduced in his book How to Make Money in Commodities (1960) the “Ten-Day Moving Average” rule, considered as the original version of Keltner channels. This original version used SMA instead of EMA. The current version of this indicator is attributed to Linda Bradford back in the 80s of the 20th century who introduced the ATR in the calculation of the channel bands.

Read more

Global stock exchanges continue their bull market

Stock markets rose during the past week after China’s Ministry of Commerce announced last Thursday on its website that the United States and China will resume talks early next month in Washington. The commercial representatives of the two countries will hold preliminary talks in mid-September to prepare high-level negotiations in October.

The announcement came after a call between China’s vice prime minister, Liu He, the US trade representative, Robert Lighthizer, and US Treasury Secretary Steven Mnuchin. As reported by the Ministry of Commerce, the governor of China’s central bank, Yi Gang, also participated in the telephone conversation.

Read more

Markets will be affected today by the entry into force of the new tariffs

Global stock markets began cautiously in September after the United States and China imposed new simultaneous tariffs, thereby raising market concerns about the slowdown in global growth.

The US imposed tariffs of 15% as of Sunday on a series of Chinese products that include footwear and some appliances such as smart watches and televisions, while Beijing imposed new tariffs on soybeans and US crude.

China reacted to the entry into force of US tariffs on Chinese exports with new tariffs on US products between 5% and 10%. However, the Asian giant has responded cautiously to Washington’s taxes, taxing only one third of the 5,000 expected products.

Read more