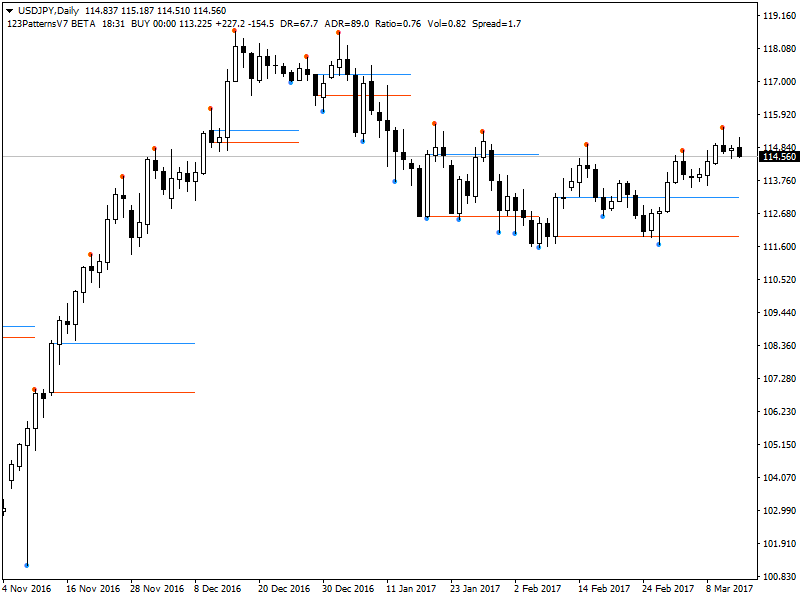
1-2-3 Patterns Indicator for Metatrader 4

The 1-2-3 pattern is a classic trend reversal price formation that occurs in all markets and can be observed in any time frame. It has stood the test of time thanks to its reliability, which is high compared to other chart price patterns. In fact, many trading strategies today are based on this chart pattern.

However, as with all price formations, the problem is learning to spot 1-2-3 patterns on the price charts, which is not easy for beginning traders due to their lack of experience. Also, most traders don’t want to spend their hours watching price charts. I think this is one of the main reasons why pattern-based strategies don’t work for many traders.

For that reason, we include a free custom indicator for Metatrader 4, which shows 1-2-3 bullish and bearish patterns on any price chart and in any time frame. This tool saves the trader a lot of time and works as they do not have to find the patterns on their own.

Read more

FBS Broker 12 Years Promotion – Trading Tournament

FBS 12 years promotion

The Forex and CFD broker FBS is hosting a trading tournament for all its clients in celebration of its 12th anniversary with a total of $1,200,000 in prizes. This competition will take place between February 1 and July 1, 2021, in four rounds of one month each (three regular rounds and a Grand Final). Among the Grand Final prizes are … Read more

Three Line Break Indicator for Metatrader 4

Line Break Chart for MT4

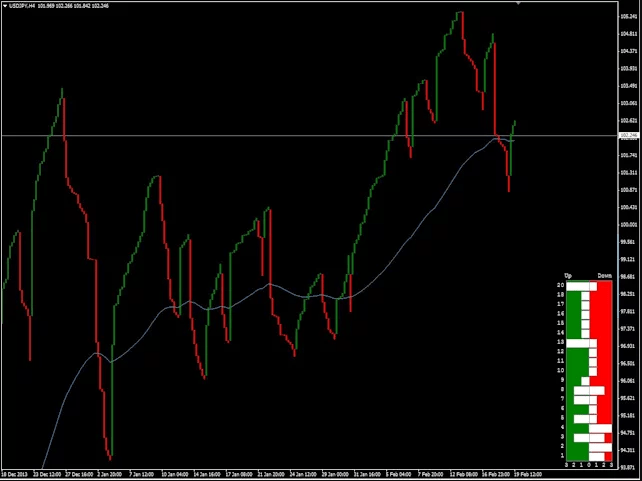
Three Line Break charts were invented in Japan and are similar to Renko and Point & Figure charts. One trader from Japan described Three Line Break charts as a “more subtle form of Point & Figures charts, where reversals of price direction are decided by the market and not by arbitrary rules”. One of the most notable features of these charts is that they are time-blind and only change when closing prices move by a certain number of points higher or lower.

These charts show a series of vertical lines (or “blocks”) of varying size (Renko charts uses a fixed block size). Green blocks (traditionally white) represent rising prices, while red blocks (traditionally black) portraying falling prices. The blocks continue in the same direction until a price reversal is warranted.

Read more

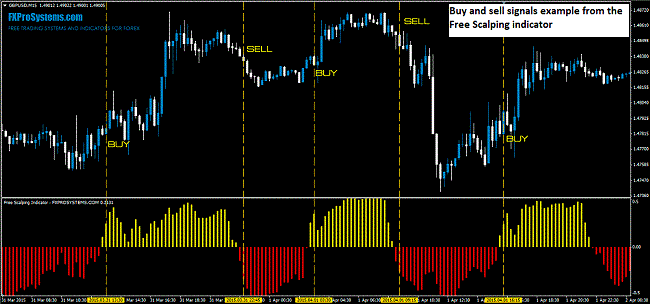
Free Scalping Indicator for Metatrader 4

Free scalping indicator example

Introduction

Scalping is a very popular trading style because it allows obtaining multiple profits with short-term trades and can be used in practically any asset and financial instrument. Likewise, it does not require a deep knowledge of fundamental analysis (although it is always convenient to take these events into account) or technical analysis. In fact, many scalping trading systems are based on relatively simple approaches.

Scalping is applied in short-term time frames in which micro trends are formed that last a few minutes and require fast entries and exits. For this reason, scalping is not for traders who prefer to perform long-term trades that generate hundreds and even thousands of pips of profit, which in fact appear only a few times a month.

Read more

Free QQE Indicator for Metatrader 4

QQE Indicator for MT4

In this article we are going to present a technical indicator designed for the Metatrader 4 platform which displays the QQE (Quantitative Qualitative Estimation) indicator below the price chart of any trading instrument that we are analyzing, be it a currency pair, a precious metal, an index or a stock.

At the end of this article, you will be able to download the indicator at no cost.

Read more

Investors ask court to declare that XRP is not a security

Lawsuit of SEC against Ripple
Source: Reuters
  • Investors request amendment in SEC case against Ripple.
  • They say that US exchanges are set to suspend XRP trading, which is going to hurt them economically.

A group of investors in the cryptocurrency XRP filed a petition in the Rhode Island District Court, requesting a mandamus order or injunction against the acting president of the United States Securities and Exchange Commission (SEC), Eliad Roisman, to modify the lawsuit against Ripple Labs, INC.

Read more

How to calculate the mathematical expectation of a trading system

Calculating the mathematical expectation of a trading system is one of the first things that should be done to know if the system is capable of making money in the long term. Having a positive mathematical expectation is an indispensable condition that any moderately reliable system must meet.

The mathematical expectation measures the amount that is expected to be won or lost on average for each trade we do. For its calculation to be reliable, it is best that we take into account as many trades as possible.

Read more

How to Measure a Trading System? – Ratios to assess your performance and risk

Example of equity drawdown

When you design a trading system, or you are looking to buy an automatic robot on the market, you must make decisions according to your preferences. The first thing you should ask yourself is: what am I looking for?

It is clear that you are looking to earn a lot of money, yes… this is what we all seek. But after a few losses and disappointments you learn that in Forex and other markets there are no magic methods and that the perfect trading system does not exist.

So, the right question is: how can you evaluate and compare different trading systems according to their risk level and potential benefit to know if they are viable for your use?

In this article we are going to review different statistical metrics to assess the performance of an investment system.

Read more

Forex Currency Correlations Explained – Definition and Uses

Forex Correlations Table

Forex Currency Correlations Table

Have you ever noticed that when a certain currency pair rises, another currency pair falls? Or that sometimes when one pair falls, another pair seems to copy its movement and falls too. If the answer is yes, you have witnessed an example of a Forex currency correlation.

What is currency correlation?

In the financial world, correlation is a statistical measure of how two securities move relative to each other.

Read more