The Rectangle Pattern – Trend continuation chart pattern

Rectangle pattern

The rectangle is a trend continuation pattern and consists of a price formation in which demand and supply are apparently balanced for a certain period of time. The price moves in a narrow range where it finds a support at the bottom of the rectangle and a resistance at the top of the figure.

Finally, the price ends up breaking out the rectangle range, either through support or resistance. If the previous trend was bullish, then the breakout is most likely to be bullish, but if the previous trend was bearish, the move will most likely be bearish.

However, the rectangle can also be a reversal trend pattern, for example if the previous trend was bullish and the pattern breakout occurs on the downside or when the previous trend was bearish and the price breaks through resistance.

Read more

Economic Cycle – Concept and Definition

The economic cycle is a series of phases that the economy goes through and that happen in order until reaching the final phase in which the economic cycle begins again.

Each cycle goes through periods of recession and periods of expansion. This phenomenon has been common throughout economic history, being known by other names such as “business cycles” or “cyclical fluctuations“.

It is known as economic cycle because once finished it starts again from the beginning forming a continuous wheel. However, due to its unpredictability this cannot be taken as a formal rule.

In the upward phases the economy improves and jobs are created, while in the downward phases the economy decreases. It is in the periods of contraction when economic crises break out. When oscillations of great intensity occur, economies can experience economic bubbles.

Read more

The Schiff Pitchfork – Construction and Variants

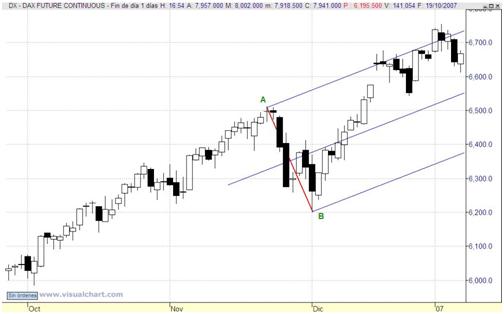
In a previous post we saw the use of the Andrews Pitchfork, a trading technique very used and known by many traders. But there is a less known variant of this method developed by a student of Andrews surnamed Shiff, who worked as a trader on the NYSE. The technique developed by this trader is intended to solve the problem that occurs when the Andrews Pitchfork presents a very marked inclination.

In this case, the Schiff Pitchfork shares with the Andrews Pitchfork the use of the line that is between points A and B, which is referred to as midline. The main difference however is that the construction of both Pitchforks is somewhat different. To construct the Schiff Pitchfork the following procedure is used:

Read more

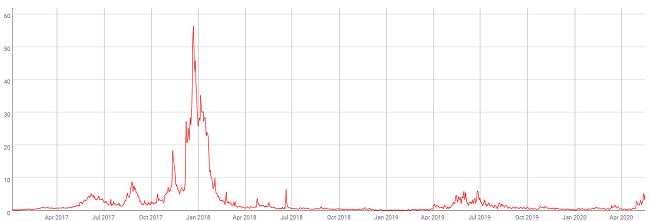
95% of bitcoin trading volume is concentrated in 4 exchanges

Theter trading data
  • Tether dominates among stablecoins in terms of bitcoin trading volume.
  • Coinbase remains the leading cryptocurrency exchange for bitcoin in terms of trading volume.

On June 2 Coin Metrics released a report explaining various relevant facts about bitcoin market volumes.

Given the growing institutional interest in bitcoin, Coin Metrics decided to study the subject from the perspective of an institution that considers entering the market, distribution and size of bitcoin volume in various markets. The data expressed in that report was taken from the bitcoin market records in May 2020.

Read more

Cex.io Review – Exchange and Cryptocurrency Broker

Cex.io   -It is a company with years of experience in the market. -It allows to easily buy and sell the main cryptocurrencies. -It is located in the United Kingdom. Visit CEX.io Website There are few cryptocurrency exchanges that have managed to remain reliable and stable over time within this market, we have witnessed how even the largest have fallen, … Read more

What is a blockchain fork?

In software development, a fork is the creation of a project in a different direction from the main or official project from the existing source code. This practice is in common use in open source projects or free software. In blockchain networks, forks are used both to create new projects from a previous one, and to update a project in question.

Blockchain networks are governed by rules encoded in the protocol that allow nodes to validate transaction blocks in the same way and remain in consensus. These rules verify that the structure of the block and the transactions included in it, such as the size of the block (amount of available space) are correct.

Sometimes consensus rules can be modified to add updates or protect the network from attacks, or changed for specific purposes, such as giving birth to a new cryptocurrency. Regardless of the reason for the modification, there are two ways to change the rules: using a soft fork or hard fork.

Read more

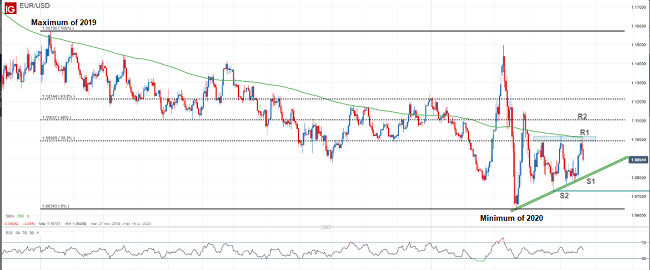
EUR/USD Bullish Momentum Ends After Collision with Resistance Confluence Zone

EUR/USD stops at the 1.1000 zone and turns lower. Investor sentiment could determine the pair’s short-term trend in the coming sessions. In this article we present the most important technical levels to consider. The EUR/USD currency pair deepens bearish movements and accumulates two consecutive days of losses since last week after the price was rejected by technical resistance at 1.1000 … Read more

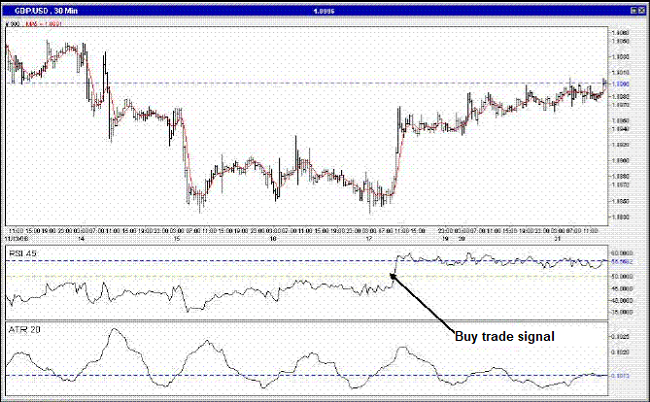
Trading System with RSI Oscillator and ATR Indicator

This trading strategy is ideal for traders who work full time but want to build a lucrative career as traders in the Forex or other markets, without having to sacrifice time from their work or other activities.

It is a system that uses several well-known and widely used technical indicators, the RSI, the moving averages and the ATR, to generate market entry and exit signals. These indicators are found in all graphical analysis packages on the market.

Read more

Difficulty Adjustment After Bitcoin Halving Comes with High Transaction Fees

Key facts:

  • The hash rate reduction after halving has congested Bitcoin for the past few days.
  • On Wednesday May 20 there was a -6% adjustment to the mining difficulty in Bitcoin

One of the first consequences of the third halving in the history of Bitcoin, which occurred just over a week ago, has been the reduction of the hash rate, or accumulated processing power of miners in the BTC network. With that reduction, the network has become congested and, currently, that is clearly reflected in transaction fees that have not been seen for almost a year.

Read more

FRAMA Moving Average Indicator For Metatrader 4

The Fractal Adaptive Moving Average (FRAMA) is a technical indicator developed by John Eulers. It is not as well known as the simple moving average (SMA) and other common types of moving averages, but it does have some interesting features.

This moving average is constructed based on the EMA (Exponential Moving Average) algorithm, in such a way that the smoothing factor is calculated based on the current fractal dimension of the price series. The advantage of FRAMA over other moving averages is that it can follow strong trend movements but at the same time is able to react more slowly in periods of market consolidation.

All types of analysis with moving averages can be used with this indicator. Additionally, the FRAMA moving average can be used in the same trading strategies that traditional moving averages are normally used, including strategies based on moving average crossovers.

Read more